I wish you all a Happy New Year for a successful 2012 blogging year.
See you in 2013 and here is me playing a medley from Final Fantasy XIII-2 I just arranged for this occasion from my favorite composer Masashi Hamauzu.


 |
| Chart 1: COMEX Gold |
 |
| Chart 2: COMEX Silver |
 |
| Table 1: COFER Q3 2012 |
 |
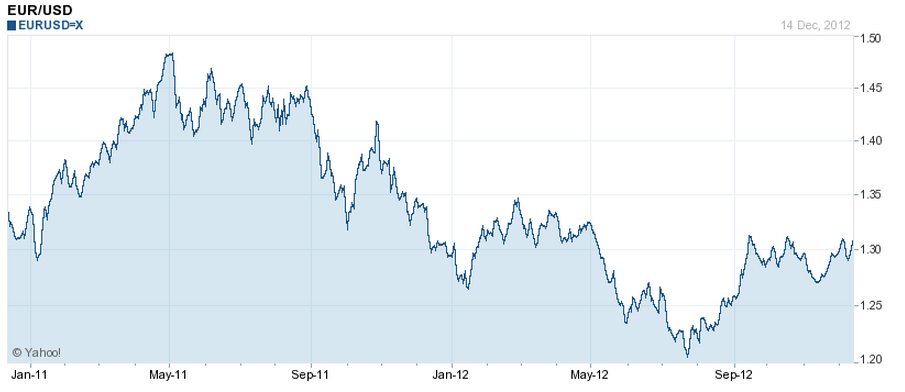
| Chart 1: EUR/USD |
 |
| Chart 2: Foreign Exchange Reserves |
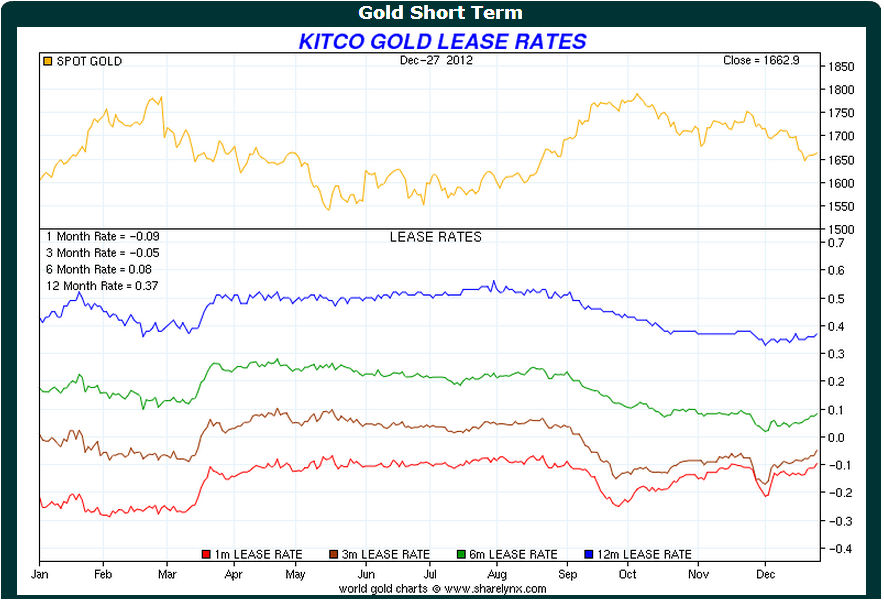 |
| Chart 1: Gold Lease Rates |
 |
| Chart 1: West/East Gold Reserves |
 |
| Chart 1a: Copper Contango Vs. Copper Price |
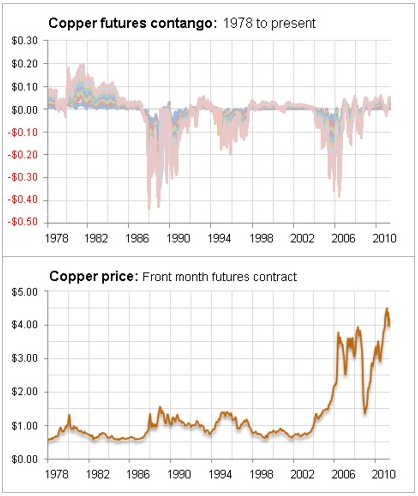 |
| Chart 1b: Historical Copper contango |
 |
| Chart 2: LME Copper Stock |
 |
| Chart 1: Bonds Vs. Gold |
 |
| Chart 2: Bonds Vs. Gold |
 |
| Chart 1: All-in Cost of Gold Mining |
 |
| Chart 2: Replacement cost for an ounce of gold |
 |
| Chart 1: Open Interest Silver |
 |
| Chart 2: LCNS Net Short Positions Silver |
 |
| Chart 0: Industrial Production: Manufacturing |
 |
| Chart 1: Industrial Production Index |
 |
| Chart 2: CRB Metals Sub-Index |
 |
| Chart 1: Gold COMEX Stock |
 |
| Chart 2: Open Interest Gold |
 |
| Chart 3: Silver COMEX Stock |
 |
| Chart 4: Open Interest Silver |
 |
| Chart 1: Copper contango Vs. Copper price |
 |
| Chart 1: Nomura Holdings |
 |
| Chart 1: U.S. Unemployment Vs. Capacity Utilization |
 |
| Chart 2: Capacity Utilization Belgium |
 |
| Chart 3: Unemployment Rate Belgium |
 |
| Chart 4: Capacity Utilization Canada |
 |
| Chart 5: Unemployment Rate Canada |
 |
| Chart 6: Capacity Utilization Euro Area |
 |
| Chart 7: Unemployment Rate Euro Area |
 |
| Chart 8: Capacity Utilization Japan |
 |
| Chart 9: Unemployment Rate Japan |
 |
| Chart 1: Iron Ore Consumption by Continent |
 |
| Chart 2: Iron Ore Production by Continent |
 |
| Chart 1: Platinum to Gold Ratio |
 |
| Chart 1: COMEX gold |
 |
| Chart 1: Copper Contango Vs. Copper Price |
 |
| Chart 1: Copper Price |
 |
| Chart 1: LCNS Silver Net Short Positions |
 |
| Chart 2: Silver Lease Rates |
 |
| Chart 3: COMEX silver stock |
 |
| Chart 4: Sprott PSLV premium |
 |
| Chart 5: Gold Miners Vs. Gold Price |
 |
| Chart 1: China Gold Imports from Hong Kong October 2012 |


