


I like this video.
Showing posts with label currency. Show all posts
Showing posts with label currency. Show all posts
Tuesday, 11 June 2013
Sunday, 16 September 2012
Ben Bernanke recently announced QE3 and it is estimated by Bank of America that the federal reserve balance sheet will go to $5 trillion in two years from now (end of 2014). If we know that the federal reserve balance sheet will go to $5 trillion in two years from now, I want to point out what this means to the U.S. dollar denominated in gold (GLD). How much depreciation in U.S. dollars can investors expect due to QE3? For the answer we need to take a look at the money supply measures of M0 and M1.
On Chart 1 we see the current Federal Reserve Balance Sheet and this balance sheet correlates to base money M0 (Chart 3). M0 (or monetary base) is basically the U.S. dollars and coins in your wallet (Chart 2) (biggest part of M0 namely "currency in circulation") (not in the bank) + deposits held by depository institutions at Federal Reserve Banks.
As you can see, currency in circulation was going up very steadily together with the federal reserve balance sheet during the period 1985 till 2008. We went from around $200 billion in 1985 to $800 billion in 2008. Then suddenly the federal reserve balance sheet exploded by $2 trillion, while the currency in circulation (your money in your wallet) only went up $300 billion. That means the federal reserve's increase in balance sheet (printing of money) hasn't adequately increased currency in circulation.
The extra $2 trillion in QE3 recently announced by Ben Bernanke (expansion of the federal reserve balance sheet) is expected to have the same effects. This is because all of the expansion in the federal reserve balance sheet is going to the excess reserves of depository institutions (Chart 4). You can find these excess reserves by simply subtracting Chart 2 (Currency in Circulation) from Chart 3 (M0: Base Money).
This will give Chart 4: Excess Reserves of Depository Institutions. This increase in excess reserves is seen by many to be a sign that inflationary pressure will come to the U.S. economy and the U.S. dollar.
One simple model for determining the long-run equilibrium exchange rate is based on the quantity theory of money: MV=PT. Money x Velocity = Price x Transaction. A one-time increase in the money supply is soon reflected as a proportionate increase in the domestic price level (everything becomes more expensive). The increase in the money supply is also reflected as a proportionate depreciation of the currency against other foreign currencies.
The question is, how much depreciation will we see in the U.S. dollar against the real currency: Gold?
You can find the answer here.
(click to enlarge) 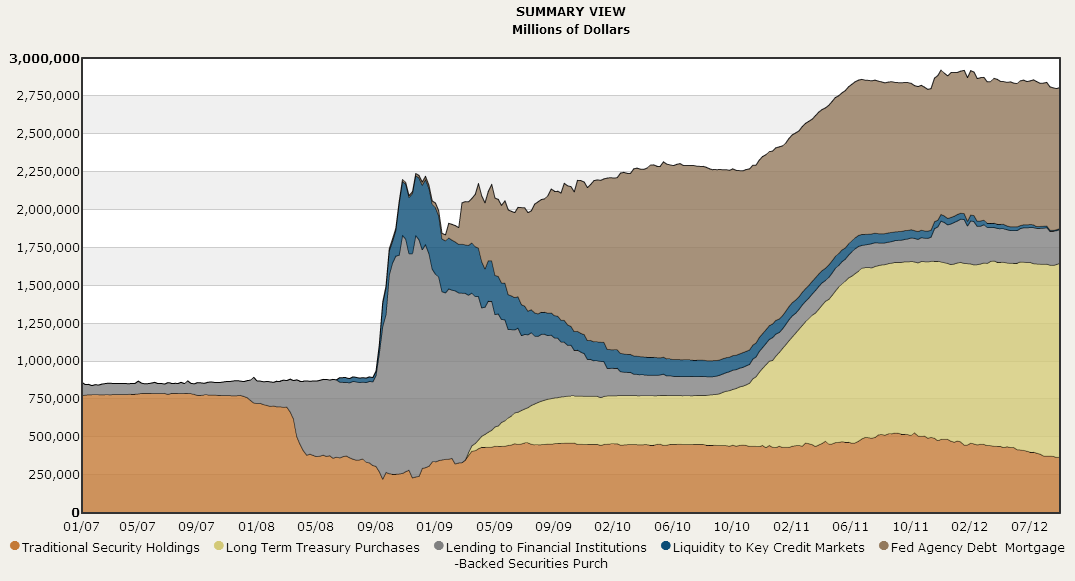 |
(click to enlarge)  |
(click to enlarge) 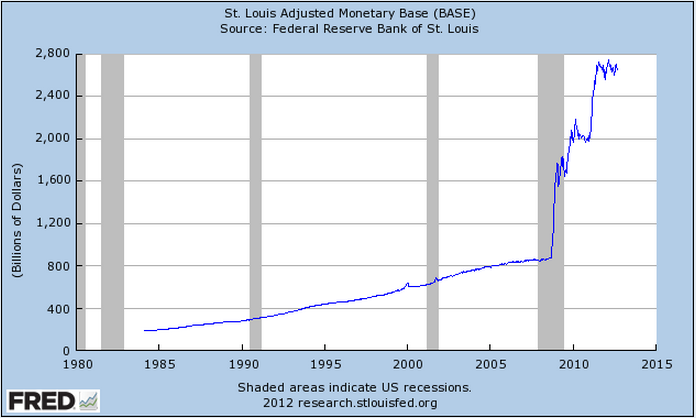 |
Chart 3: Base Money (M0) |
On Chart 1 we see the current Federal Reserve Balance Sheet and this balance sheet correlates to base money M0 (Chart 3). M0 (or monetary base) is basically the U.S. dollars and coins in your wallet (Chart 2) (biggest part of M0 namely "currency in circulation") (not in the bank) + deposits held by depository institutions at Federal Reserve Banks.
As you can see, currency in circulation was going up very steadily together with the federal reserve balance sheet during the period 1985 till 2008. We went from around $200 billion in 1985 to $800 billion in 2008. Then suddenly the federal reserve balance sheet exploded by $2 trillion, while the currency in circulation (your money in your wallet) only went up $300 billion. That means the federal reserve's increase in balance sheet (printing of money) hasn't adequately increased currency in circulation.
The extra $2 trillion in QE3 recently announced by Ben Bernanke (expansion of the federal reserve balance sheet) is expected to have the same effects. This is because all of the expansion in the federal reserve balance sheet is going to the excess reserves of depository institutions (Chart 4). You can find these excess reserves by simply subtracting Chart 2 (Currency in Circulation) from Chart 3 (M0: Base Money).
This will give Chart 4: Excess Reserves of Depository Institutions. This increase in excess reserves is seen by many to be a sign that inflationary pressure will come to the U.S. economy and the U.S. dollar.
(click to enlarge) 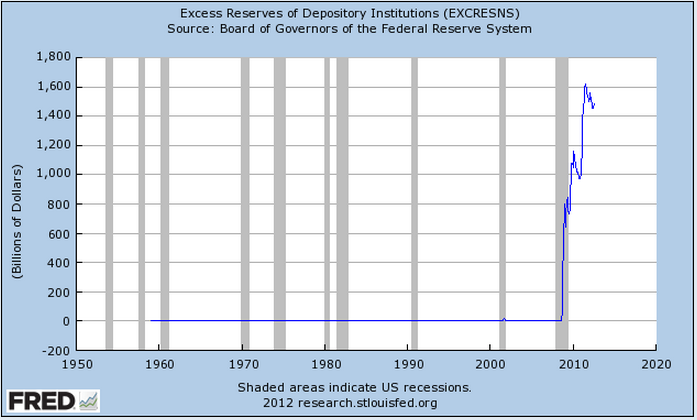 |
One simple model for determining the long-run equilibrium exchange rate is based on the quantity theory of money: MV=PT. Money x Velocity = Price x Transaction. A one-time increase in the money supply is soon reflected as a proportionate increase in the domestic price level (everything becomes more expensive). The increase in the money supply is also reflected as a proportionate depreciation of the currency against other foreign currencies.
The question is, how much depreciation will we see in the U.S. dollar against the real currency: Gold?
You can find the answer here.
Friday, 11 May 2012
It's amazing how the euro has outperformed gold since Hollande became president of France (Chart 1-4). It signals that there is a higher risk that Greece will not get their aid package. Euro global polls say that there is 50% chance that Greece will exit the Eurozone. If this were to happen it will be a deflationary collapse first, after which hyperinflation will occur.
As Europe is going to contract in 2012, Mario Draghi has signaled that further stimulus is on its way.
 |
| Chart 1-4: Gold Price in Euros |
During the second half of 2011 we even see that the euro is losing its secondary currency reserve status. The U.S. dollar is increasing its status as reserve currency (Table 1).
 |
| Table 1: Reserve Currency |
Jim Rogers knows this and might sell the euro in the future.
As Europe is going to contract in 2012, Mario Draghi has signaled that further stimulus is on its way.
Subscribe to:
Posts (Atom)


