UnidoRecruitingNATIONAL

  • Subscribe to our RSS feed.
  • Twitter
  • StumbleUpon
  • Reddit
  • Facebook
  • Digg
Showing posts with label gdp. Show all posts

Wednesday, 31 July 2013

New GDP Calculation taking effect

Posted on 13:32 by Unknown
If you recall my article on the newly invented way of calculating GDP, well we are at that point now.


Today, the new GDP numbers (including legal bills, art, music, theatre and imaginary pension funds) were in effect. Real GDP grew 1.7% on an annualized basis in the second quarter of 2013.

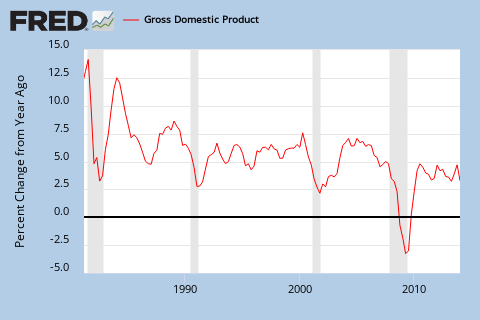
As you can see, the old nominal GDP numbers (red chart) and the new nominal GDP numbers (green chart) are about 3% different from each other. 

Nominal GDP

With these new numbers in place, my zero hour debt chart is being reformed to this.

You can see the large drop there, meaning that debt has actually dropped due to the debt limit.
Zero Hour Debt
Second, with these new GDP numbers, the debt to GDP ratio has declined by 3%. It isn't 105% anymore, but is now 105/(100+3) = 102%.


Good work in fudging the numbers, Ben.

(also note that stocks are now seemingly 3% less overvalued)


Read More
Posted in calculation, Debt, gdp | No comments

Monday, 15 July 2013

Correlation: Employment-Population Ratio Vs. Real GDP per Capita

Posted on 10:02 by Unknown
I like statistics that can't be fudged by the government and this is one of them: The Civilian Employment-Population Ratio. This measure is one of the best to evaluate the labor market. Each time when this ratio declines, we enter a recession. So this is a very good gauge in predicting bad periods in the overall economy.

A high ratio (above 70%) means that a lot of people are employed and this will result in a high GDP per capita. A low ratio (under 50%) is considered bad for GDP.


If we take a look at the percentage change per annum, we see that the trend for the employment-population ratio is down (blue chart). So the employment picture isn't improving and this translates into a declining real GDP per capita growth rate (red chart).


As Karl Denninger explains, the amount of employed people as a percentage of the population hasn't improved since 2008. So the economy hasn't recovered a lot.

Read More
Posted in capita, correlation, Denninger, Employment, gdp, Greg, Hunter, Karl, population, real | No comments

Sunday, 30 June 2013

Croatia To Join European Union

Posted on 11:00 by Unknown
Today, Croatia joined the European Union, time to celebrate! But should we really celebrate?

What we took in the European Union is a bunch of problems.

First off, the unemployment rate of Croatia is a staggering 20%, rivalling with Spain and Greece.

Second, its balance of trade is negative and has always posted a trade deficit.


To make matters worse, since 2008, the country was in recession and is still in a recession. Added to this, there is an almost 5% inflation in the country (which has come down to 2% just recently), which makes real GDP decline even more rapidly. As we have seen recently in this correlation, it doesn't bode well for the unemployment rate, which will keep rising.


This decline in GDP quickly added to the government's debt. A positive point is that the government debt to GDP is still at 54%, which is good. But it is worsening. External debt though, is higher at around 90% of GDP.

As debt goes up, the country's bonds had been downgraded to junk status last year. This creates the possibility of a bail out of the country by the IMF once it joins the Eurozone.

What a gift.
Read More
Posted in Croatia, Debt, European Union, gdp | No comments

Unemployment Vs. Real GDP

Posted on 04:55 by Unknown
The inverted Unemployment Rate is correlated to Real GDP and is also known as Okun's Law named after Arthur Melvin Okun.

Zero Hedge featured Okun's Law in this article.

Red curve: inverted yoy% change in unemployment rate
Blue curve: yoy% change in real GDP

Never in history has the unemployment rate been so artificially low (red graph artificially high) as today. The red curve has never been higher than the blue curve, which implies that the unemployment rate is much higher than officially reported.

We already know what the cause is: a lot of discouraged and part-time workers.

Moreover, the chart suggests that Real GDP (blue chart) is a leading indicator for the unemployment rate (inverted red chart).

As a final note, notice that we are talking about real GDP, which is inflation adjusted. This means that inflation negatively impacts real GDP and therefore inflation will in turn create higher unemployment rates at a constant GDP rate.
Read More
Posted in Arthur, gdp, Melvin, Okun, rate, real, unemployment | No comments

Wednesday, 26 June 2013

GDP revised lower

Posted on 08:59 by Unknown
As I suspected here, declining PMI will always result in lower GDP forecasts and "unexpected" revisions downward.


GDP growth was going to be 2.4% on an annual rate, now it is only 1.8% in Q1 2013.

This also means that the Zero Hour Debt chart is on track to go to zero.


More weakness is coming ahead of us as interest rates and mortgage rates go up. 


Read More
Posted in Debt, gdp, hour, PMI, zero | No comments

Tuesday, 4 June 2013

Correlation: S&P Revenues Vs. PMI

Posted on 11:24 by Unknown
Dr. Ed Yardeni's blog is a pool full of critical information and one of them is a newly discovered correlation which I will add to my collection.

Apparently the PMI is a leading indicator for the S&P revenues, which also means the PMI is a leading indicator for the overall direction of the stock market. This is consistent with the correlation between the PMI and the GDP, which is correlated to the total stock market index on itself via the Warren Buffet Rule.

So if you want to know the direction of the earnings of the financials, just look at the PMI and you can predict the trend, which is certainly down after the miss in PMI reported the previous week.
Chart 1: S&P 500 Revenues Vs. PMI
Read More
Posted in correlation, gdp, PMI, Standard and Poor's | No comments

Monday, 3 June 2013

Manufacturing PMI goes into Recession/Depression Territory

Posted on 09:02 by Unknown
Look at that => Blue Chart. 

Yes, we crossed below zero for the PMI. Do you really think GDP growth will still go up?

Three words: Not A Chance...


Read More
Posted in gdp, PMI | No comments

Sunday, 2 June 2013

What do the latest GDP numbers tell us?

Posted on 09:24 by Unknown
The GDP numbers came out this week and there was 2.4% growth yoy:
http://www.reuters.com/article/2013/05/30/us-usa-economy-idUSBRE94T0HI20130530

So what does this mean to your equity positioning?

The following chart is used to give a valuation on the stock market and gives you the tool to position yourself. It is based on the total stock index (DWCF) divided by the GNP.


The latest data says that GNP was 16.236 trillion in the first quarter of 2013.

Table 1: GDP and GNP
If we look at the Total Stock Market Index (DWCF), we have 17015.

Now divide 17015 by 16236 and we get: 1.05.

105% is modestly overvalued according to the Stock Valuation Table.

Stock Valuation Table

So I wouldn't buy equities at this stage.
Read More
Posted in dwcf, equities, gdp, index, market, stock, total | No comments

Tuesday, 30 April 2013

U.S. GDP Growth Slowing Down, Sell Stocks

Posted on 08:56 by Unknown
The Chicago PMI just went in contraction from 52.5 to 49.0. This confirms all the bad news we already had in the previous months.

I expect that with this lower PMI, the ISM manufacturing PMI composite index (NAPM) will go down too.


And with that drop, the GDP growth will most certainly drop too. I would be very cautious if you are still buying stocks, thinking it will go higher.


Read More
Posted in Chicago, gdp, PMI | No comments

Friday, 26 April 2013

GDP Misses Expectations

Posted on 08:29 by Unknown
The 2013 Q1 real GDP was weaker than expected. 2.5% year over year instead of 3.2%. With a miss in expectations, be prepared for lower stock markets as we are due for a correction. We are overvalued for sure.

But actually the number is pretty good. the GDP growth to debt growth ratio has inched up since the last release (Chart 1). Nominal GDP grew 1% from a quarter ago, while debt grew 2.4% in the same period.
Chart 1: Zero Hour Debt

Read More
Posted in Debt, gdp, hour, zero | No comments

Tuesday, 23 April 2013

The U.S. Government Has Invented a New Way of Calculating GDP

Posted on 10:03 by Unknown


In March 2013, the U.S. government invented a new way of calculating GDP. The Financial Times reported that from July 2013 onwards, the U.S. GDP would become 3% bigger due to a change in statistics.  As this adjustment in GDP calculation is pretty significant, I will try to make an observation on which changes on the U.S. GDP will take effect, what the consequences are and how investors should act on this revision in statistics.

Read more here.
Read More
Posted in calculation, Dow, gdp, Jones, revision | No comments

Saturday, 20 April 2013

GDP Vs. PMI

Posted on 02:58 by Unknown
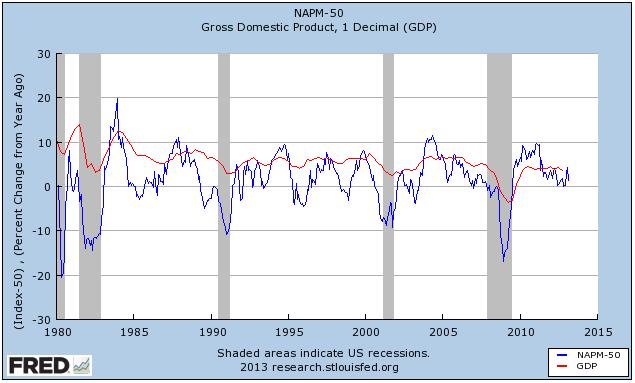
This page is created to monitor the Gross Domestic Product (GDP) Vs. ISM Purchasing Manager Index (PMI). 

When the PMI declines (blue chart), the GDP growth rate (red chart) declines.


Read More
Posted in domestic, gdp, gross, index, manager, PMI, product, purchasing | No comments

Monday, 8 April 2013

GDP Growth to be Flat Going Forward

Posted on 09:55 by Unknown
This chart says it all. We got a new data point and we see a sharp decline in PMI numbers. So I expect the red GDP curve to go down as well. Prepare yourself.
Chart 1: GDP Vs. PMI

Read More
Posted in gdp, PMI | No comments

Thursday, 4 April 2013

150% Debt to GDP

Posted on 16:13 by Unknown
On the Peter Schiff Show with Neeraj Chaudhary I learned about the 150% debt to GDP limit. If a government's debt goes above this limit, then there is no way the debt will be repaid. It's historic evidence.


In Europe, the country that has gone over the limit is Greece, Italy is at 130% as we speak. So we need to watch Italy closely.
Chart 1: Eurozone Debt to GDP
The U.S. doesn't have much time left as debt is skyrocketing.
Chart 2: U.S. Debt to GDP

Read More
Posted in Chaudhary, Debt, gdp, Neeraj, Peter, Schiff | No comments

Monday, 11 March 2013

Money Velocity Picking Up?

Posted on 12:40 by Unknown
There are rumors that money velocity is picking up. As I said before, money velocity is very important to watch as it is correlated to U.S. Treasury Yields. If money velocity goes up, yields go up.

We will discuss 2 things:
1) Is GDP going up?
2) Is MZM growth slowing down?

Go here to find out.
Read More
Posted in gdp, money, MZM, velocity | No comments

Saturday, 16 February 2013

Correlation: Total Stock Market Index Vs. GDP: How to Value Dow Jones

Posted on 07:32 by Unknown
Today I learned about the Warren Buffet valuation of the stock market by looking at the total stock market index and GNP numbers (which is almost equal to GDP numbers + $200 billion).

The total stock market index can be found here and stands at $15.879 trillion on 15 February 2013 (Chart 1). It measures the market cap of the U.S. companies. Don't confuse this chart with the Dow Jones chart.
Chart 1: Dow Jones U.S. Total Stock Market Index

Now you compare that to the U.S. GDP number, which can be found here (Chart 2).
Chart 2: U.S. GDP
If you then divide Chart 1 by Chart 2, you get Chart 3. If the chart goes above 100%, then the stock market is overvalued.

Chart 3: Market Value to GNP ratio
Here is the table for valuation:
Chart 4: Valuation Table

For example, in December 2007, the GDP was $14.25 trillion, while the total market cap was $15 trillion. 15/14.25 = 105%. Meaning overvalued.

For example, in December 2008, the GDP was $14.08 trillion, while the total market cap was $8.78 trillion.
8.78/14.08 = 62%. Meaning severely undervalued.

So today, you could say that stocks are becoming overvalued, so you should take some of your money out of the stock market while you still can.

There is a final note I want to make. If this correlation is true between the Total Stock Market Index and GDP, then you have to take in mind that GDP is very important to watch. If the GDP drops, then the stock market will most likely drop. If the GDP rises, then the stock market will most likely rise.

I pointed out many times that U.S. GDP will not go up, due to the zero hour debt problem, which I talked about here. So theoretically, the stock market cannot rise.

The only way to get GDP go up again is when debt is significantly reduced and we're not at that point yet.


Read More
Posted in correlation, Debt, gdp, index, market, stock, total | No comments

Friday, 26 October 2012

GDP Numbers are Out for Q3 2012

Posted on 06:08 by Unknown
I'm always excited when I get another data point for my zero hour debt chart. Today the GDP numbers were out for Q3 2012. The media is all positive about the 2% growth in GDP year over year, but we all know 2% is not a positive number. Nowhere in that article they mention the debt growth, GDP growth is meaningless when debt grows faster than GDP. I wrote about zero hour debt here.

We can see now, that our newest data point is right in line with our trendline.

During the 3rd quarter, GDP rose 1% from $15.6 trillion to $15.78 trillion (quarter over quarter). But the debt rose 2% from $15.7 trillion to $16.1 trillion (quarter over quarter). That's double the GDP growth!

Make your own conclusions...

Chart 1: Zero Hour Debt


Read More
Posted in Debt, gdp, hour, zero | No comments

Wednesday, 29 August 2012

Another Correlation: What is China's Real Growth Rate?

Posted on 11:13 by Unknown
In the last week of August, Marc Faber gave a signal that all is not well in China. He points out that the Chinese statistics of 7% growth are inflated to the upside. There is a big chance for a hard landing to come in China because many statistics point to a significant slowing of the Chinese economy. For example, in July, industrial production declined sharply (Chart 1).

Chart 1: China Industrial Production (yoy)
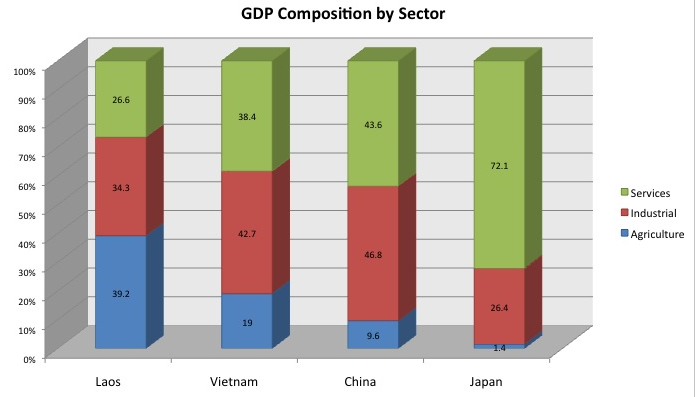
It is very important to know that commodity prices are completely dependent on the growth of China as China is the biggest consumer of commodities in the world. If for example, the U.S. slows down 10%, it would be completely meaningless and wouldn't have any influence on the price of commodities. The reason is that the U.S. GDP consists for 80% of services, which don't use any commodities (Figure 1), while China's GDP consists only for 44% of services (Figure 2). So all eyes should be on China for the commodity investor.

Figure 1: Composition of U.S. GDP
Figure 2: Composition of GDP
So what is the best way to find the real growth of China?

Find out in the full version of this article.
Read More
Posted in China, consumption, correlation, electricity, gdp, production | No comments

Saturday, 25 August 2012

Euro Vs. USD: Take Two

Posted on 05:57 by Unknown
5 months after I wrote the article about the Euro Vs. the USD, it looks like the USD has won the match against the euro. Since April 2012, the euro has lost 5% against the USD. Let's look at what has changed in those months.

Following list gives the most important indicators for the future of a currency:
  • Current account balance of the country
  • Total national debt of the country
  • Inflation rate
  • Interest rate
If the current account balance of the country is positive, a country will export more than it imports. As the population of the country exports more, they will receive more foreign money. This money will then be converted into their own currency, which is then spent or put in their banks. As the foreign money is converted into the money of the country's population their own currency will appreciate in value.

The larger the national debt of the country, the more expensive it will be to sell debt to foreigners. The government will then be obliged to monetize this debt to keep interest rates low and to be able to service this debt. Rising debt load will therefore devalue the currency.

The higher the inflation rate, the lower the currency will go. An example is Vietnam, where the dong lost much of its value due to high inflation.

When interest rates are lower than the inflation rate, there is no incentive for foreigners to buy the currency. There is no incentive to save money. The consequence is a lower currency value.

Let's look at the current statistics:

1) Current account
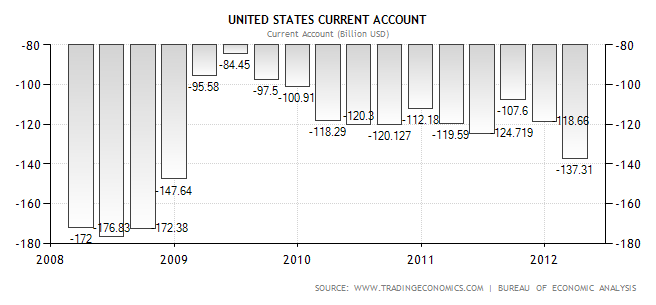
5 months ago, the current account deficit of the US was in the order of $US 110 billion per quarter, which amounted to $US 450 billion per year (2011).

For the Eurozone, the 12-month cumulated seasonally adjusted current account recorded a deficit of EUR 44.9 billion.

Today, the eurozone is posting a current account surplus of 14.9 billion euro in June, while the U.S. is increasing its quarterly deficits to $US 137 billion in the latest quarter.

So in this case, the eurozone is still the winner.

Europe VS USA: 1-0.
Euro Area Current Account (Million euro)


U.S. Current Account (Billion USD)
2) Total National Debt
Total US national debt is $US 16 trillion. Total eurozone national debt to GDP is 88.6%, the GDP is $US 17.578 trillion in 2011, which translates to $US 15.6 trillion in Eurozone debt. So again, Europe wins by a small margin.

Europe VS USA: 2-0

3) Inflation Rate
5 months ago, the inflation rate in the Eurozone was 2.6%, while the inflation rate in the U.S. was 2.9%. Today the inflation rate in the Eurozone is 2.4%, while the inflation rate in the U.S. is 1.4%. This is a significant and surprising decline in inflation rate in the U.S Vs. Europe.

Europe VS USA: 2-1.
Euro Area Inflation Rate
U.S. Inflation Rate


4) Interest Rate
5 months ago, the interest rate in the Eurozone was 1%, while the interest rate in the US was essentially zero. As we already know, Mario Draghi lowered interest rates to 0.75%, but this is still higher than the interest rate in the U.S. (0.25%). Europe VS USA: 3-1
Euro Area Interest Rate

U.S. Interest Rate
     

Conclusion: Europe still wins by 3-1 against the USA, but is losing ground through inflation. Though I think the current account surplus of Europe is the most important positive indicator of the strength of the euro in the future.

Read More
Posted in account, current, Debt, euro, gdp, inflation, Interest, rate, USD | No comments

Tuesday, 7 August 2012

China Outperforms Anyone

Posted on 12:07 by Unknown
Charts do tell us something. 

For example, when we plot the GDP of the top 20 countries in the world in a nice stacked area chart, we can clearly see that no other country than China has significant positive GDP growth. At this growth pace, it will only take 5 more years before China becomes the largest economy of the world on a country by country basis.

Yes, only 5 years! Because GDP growth may be denominated in percentage terms (which seem to be constant), but those percentage terms accumulate each year to the principal number.

Just imagine this event happening...

Chart 1: GDP of top 20 countries

Read More
Posted in China, gdp | No comments
Older Posts Home
Subscribe to: Posts (Atom)

Popular Posts

  • GLD trust gold inflow?
    Looks like the media is telling us that the GLD trust physical gold holdings are rising and giving a boost to the precious metals prices. I ...
  • Copper Inventories Rising
    With the China PMI indicating a contraction in GDP growth (of which I talked about HERE ), another sign has emerged of China slowing down. T...
  • Eric Sprott Taking Silver Off The Market With Offering
    Yesterday, Eric Sprott priced a follow-on offering at $US 200 million, which is a 20% increase in its silver holdings. This will certainly i...
  • ECB Rate Cut and its Effect on Euribor
    On Thursday 5 July 2012, the ECB cut its main refinancing rate to 0.75% and its deposit rates to 0%. After LTRO I and LTRO II, we have anoth...
  • The Correlation Between Open Interest And COMEX Stock Levels
    Just a few days ago,  I reported  that J.P. Morgan vault had a significant amount of eligible gold taken away. I didn't know what it mea...
  • Public Sector Credit Expansion Vs. Private Sector Credit Contraction
    In 2009, Marc Faber said these words at one of his famous seminars:  "But for the fiscal stimulus to even have a small chance of succe...
  • More and More Discouraged Workers
    This following graph should be concerning. We have government statistics (grey and red chart) and we have the real SGS Shadowstats statistic...
  • Correlation: Fed Funds Rate Vs. 10 Year Bond Yields
    Another correlation Azizonomics  taught me is the Fed Funds Rate Vs. 10 Year Bond Yield (Chart 1). As long as the federal reserve keeps inte...
  • Correlation: The Ultimate Tool to Predict Gold and Gold Miners Price Swings
    It's amazing, every day I learn something new. Today I present another very reliable tool to predict tops and bottoms in the gold price ...
  • Capacity utilization rate April 2012 79.2% above estimates
    In my previous article I pointed out how important it is to follow the capacity utilization rate to estimate the prices of gold and silver ...

Categories

  • 10 (1)
  • 10 year treasuries (1)
  • 1987 (1)
  • 2012 (7)
  • 30 (1)
  • account (1)
  • acquisitions (1)
  • adjustable (1)
  • ADP (1)
  • Advantage (1)
  • aggregates (2)
  • AGQ (1)
  • agriculture (1)
  • Akamai Technologies (1)
  • alert (1)
  • Alex Jones (1)
  • Allan Meltzer (1)
  • Allana (1)
  • Allana Potash (1)
  • amber gold (1)
  • America (1)
  • and (2)
  • Angela (1)
  • APMEX (5)
  • applications (1)
  • April 2012 (1)
  • arbitrage (2)
  • Arthur (1)
  • asia (2)
  • Asian (1)
  • At. Augustine Gold (1)
  • Atlantic Economy Summit (1)
  • AUD (1)
  • Australian dollar (1)
  • automotive (2)
  • average (3)
  • Avino (1)
  • bac (2)
  • backing (1)
  • backwardation (6)
  • balance (8)
  • balance sheet (3)
  • Baltic (1)
  • Baltic Dry Index (1)
  • Bank (10)
  • Bank of America (1)
  • Bankrupt (1)
  • bankruptcy (2)
  • banks (3)
  • bar (1)
  • Barclays (1)
  • Bargain (1)
  • Barrick Gold (1)
  • base (1)
  • base money (1)
  • Bass (1)
  • BCS (1)
  • beleggerscompetitie (4)
  • Belgium (10)
  • Ben (3)
  • Ben Bernanke (4)
  • Bernanke (4)
  • Bernstein (1)
  • BHP (1)
  • bitcoin (8)
  • blog (1)
  • BNP (1)
  • bond (14)
  • bond yields (1)
  • bonds (33)
  • boom (1)
  • Brad Cooke (1)
  • Brazil (1)
  • brent (2)
  • Brink's (2)
  • brother (1)
  • BrotherJohnF (1)
  • bubble (2)
  • budget (2)
  • Budget Deficit (1)
  • Buffett (2)
  • building (2)
  • bullion (1)
  • bullish (1)
  • buyback (1)
  • buying (1)
  • c (1)
  • calculation (2)
  • Cambridge (1)
  • Canada (1)
  • Capacity (8)
  • Capacity Utilization (7)
  • Capesize (1)
  • capita (1)
  • Capstone Mining (1)
  • car crash (1)
  • Case-Shiller (1)
  • Casey (1)
  • Cash is Trash (1)
  • cattle (1)
  • ceiling (4)
  • celente (2)
  • cement (1)
  • central (2)
  • CFTC (3)
  • Chaudhary (1)
  • Chicago (2)
  • China (48)
  • China Construction Bank (1)
  • CHK (1)
  • chocolate (1)
  • Citigroup (2)
  • city (1)
  • claims (3)
  • CLF (1)
  • cliff (3)
  • CME (11)
  • cnbc (2)
  • CNT depository (1)
  • coal (2)
  • cocoa (1)
  • COFER (2)
  • coffee (1)
  • comedy (1)
  • COMEX (33)
  • commercial (1)
  • Commerzbank (1)
  • commodities (4)
  • commodity (1)
  • competition (1)
  • composition (1)
  • Conan (1)
  • Conference (2)
  • congress (1)
  • consumer (4)
  • consumption (2)
  • Contango (26)
  • contraction (1)
  • convention (1)
  • copper (34)
  • copper contango (1)
  • corn (2)
  • Corp (1)
  • correlation (54)
  • correlations (7)
  • cost (5)
  • costs (1)
  • COT (4)
  • cotton (1)
  • council (1)
  • country (2)
  • county (1)
  • cover (1)
  • CPI (5)
  • crash (2)
  • CRB (3)
  • credit (2)
  • Credit Agricole (1)
  • Croatia (1)
  • crude (3)
  • currency (3)
  • current (1)
  • curve (1)
  • Cut (1)
  • Cyprus (7)
  • Da (1)
  • daily (1)
  • Dan Norcini (1)
  • David (1)
  • David Morgan (2)
  • DB (1)
  • de-peg (1)
  • Debt (30)
  • debt ceiling (2)
  • debt limit (1)
  • December (1)
  • decoupling (7)
  • default (4)
  • deficit (7)
  • deflation (2)
  • delivery (1)
  • Demand (6)
  • Denmark (2)
  • Denninger (1)
  • deposit (8)
  • deposit facility (1)
  • deposits (3)
  • diamond (1)
  • Discouraged (1)
  • disposable (1)
  • dividend (1)
  • DJP (1)
  • DNC (1)
  • dollar (2)
  • domestic (1)
  • Doug (1)
  • Dow (7)
  • drop (1)
  • Dry (1)
  • durable (1)
  • dwcf (1)
  • earnings (4)
  • earnings per share (1)
  • ECB (6)
  • economy (1)
  • Ecuador (1)
  • elections (1)
  • electricity (2)
  • eligible (2)
  • Embry (1)
  • Employment (1)
  • Endeavour (1)
  • Endeavour Silver (2)
  • Engelhard (1)
  • eps (3)
  • equities (3)
  • equity (1)
  • equity markets (1)
  • Eric (6)
  • Eric Sprott (1)
  • estate (2)
  • estimate (1)
  • ETF (3)
  • Ethiopia (1)
  • Ethiopian Potash (1)
  • eur (1)
  • Eureka (1)
  • Euribor (2)
  • euro (8)
  • Europe (7)
  • European Union (1)
  • Eurozone (1)
  • exchange (1)
  • EXK (1)
  • expansion (1)
  • experiment (4)
  • exploration (1)
  • export (1)
  • exports (1)
  • Exposure (1)
  • external (1)
  • Faber (3)
  • family (1)
  • Faustian (1)
  • fed (2)
  • federal (10)
  • federal reserve (3)
  • Fertilizer (1)
  • Financial Services Committee (1)
  • First (3)
  • First Majestic Silver Corp. (1)
  • fiscal (3)
  • fiscal cliff (1)
  • fixed (1)
  • food stamps (1)
  • food stamps hire people (1)
  • foreigners (4)
  • forex (1)
  • Forum (1)
  • forward (1)
  • franc (1)
  • France (3)
  • Fraser (1)
  • French (1)
  • fund (1)
  • funds (3)
  • gas (1)
  • Gazprom (1)
  • gdp (25)
  • George Soros (1)
  • Germany (3)
  • gld (3)
  • GNP (1)
  • GOFO (4)
  • Gold (130)
  • gold money index (1)
  • golden cross (1)
  • Goldman (1)
  • Goldman Sachs (2)
  • goldonomic (1)
  • goods (1)
  • got gold report (1)
  • government (2)
  • great (1)
  • Great Depression (2)
  • Greece (8)
  • Greg (1)
  • gross (1)
  • growth (1)
  • GS (1)
  • GSK (1)
  • Hampshire (1)
  • Hang Seng (1)
  • Happy New Year (1)
  • Hedge (1)
  • Hewlett Packard (1)
  • Hitler (1)
  • HMI (1)
  • holding (1)
  • holdings (4)
  • Hole (1)
  • Hollande (4)
  • home (1)
  • hong (7)
  • Hong Kong (11)
  • hour (4)
  • hourly (3)
  • Housing (8)
  • housing market index (1)
  • HSBC (1)
  • Hunter (1)
  • Hyperinflation (3)
  • IMF (1)
  • import (14)
  • imports (16)
  • income (1)
  • index (13)
  • India (1)
  • industrial (2)
  • industry (1)
  • inflatiion (1)
  • inflation (11)
  • iniflation (1)
  • initial (3)
  • initial claims (1)
  • initiative (1)
  • Insider (1)
  • insider trading (1)
  • institute (1)
  • interconnectivity (1)
  • Interest (9)
  • interest payment (1)
  • Interest Rates (1)
  • inventory (1)
  • investment (2)
  • Investor (1)
  • Iran (4)
  • Ireland (1)
  • Iron (2)
  • Iron ore (2)
  • Irwin (1)
  • Israel (2)
  • Italy (4)
  • J.P. Morgan (7)
  • J.P. Morgan Chase (1)
  • Jackson (1)
  • James (5)
  • James Turk (2)
  • Japan (10)
  • jesse jackson (1)
  • Jim (1)
  • Jim Rogers (1)
  • Jim Sinclair (1)
  • JNJ (1)
  • job cuts (1)
  • jobless (2)
  • John (3)
  • John Davis (1)
  • Jones (2)
  • JP Morgan (1)
  • jpm (1)
  • July (1)
  • June (2)
  • junk (3)
  • Karl (1)
  • keiser (2)
  • king world news (1)
  • Kohler (1)
  • kong (7)
  • KWN (2)
  • Kyle (1)
  • Kyle Bass (1)
  • laptop (1)
  • large commercial (1)
  • Las (1)
  • LBMA (3)
  • LCNS (9)
  • Lease (8)
  • Lease rate (3)
  • lease rates (2)
  • Lecture (1)
  • lending (1)
  • leverage (1)
  • Liberty (1)
  • LIBOR (3)
  • Lloyds (1)
  • LME (3)
  • Loans (1)
  • london (2)
  • long (1)
  • LTRO (3)
  • lumber (1)
  • M0 (1)
  • M1 (1)
  • M2 (1)
  • M3 (2)
  • Majestic (3)
  • Maloney (1)
  • manager (1)
  • manipulation (1)
  • Marc (3)
  • Marc Faber (11)
  • March (1)
  • margin (1)
  • marginal (4)
  • market (5)
  • Mastercard (1)
  • maturity (2)
  • Mauldin (1)
  • max (2)
  • max keiser (3)
  • May (1)
  • MBS (5)
  • Melvin (1)
  • merger (1)
  • Merkel (1)
  • metal (1)
  • metals (7)
  • Metdist (1)
  • MF global (1)
  • Michael (2)
  • Middle East (1)
  • Mike (1)
  • Mike Maloney (2)
  • miners (2)
  • mines (1)
  • Mining (4)
  • minister (1)
  • Mint (1)
  • monetary (1)
  • money (4)
  • Moneyshow (1)
  • monitoring (1)
  • Monitoring of decoupling (1)
  • Morgan (1)
  • Morgan Stanley (1)
  • mortgage (6)
  • Moustache (1)
  • moving average (1)
  • MZM (3)
  • natural (1)
  • Natural gas (3)
  • Neeraj (1)
  • Negative (3)
  • net (4)
  • Netherlands (2)
  • New (1)
  • News (1)
  • nickel (1)
  • Noel (1)
  • Nomura (2)
  • non farm payroll (1)
  • non-farm payroll (1)
  • NOS (1)
  • Novartis (1)
  • O'Brien (1)
  • obesity (1)
  • Occupy (1)
  • Offering (1)
  • oil (9)
  • oil embargo (1)
  • Okun (1)
  • olivut resources (1)
  • OLV (1)
  • Onion (1)
  • open (3)
  • orders (1)
  • ore (1)
  • outflow (1)
  • outlay (4)
  • outlays (1)
  • overnight (1)
  • P/B (1)
  • P/E (2)
  • palladium (4)
  • Pan American Silver (1)
  • Panamax (1)
  • paper (1)
  • Paulson (1)
  • payment (1)
  • payroll (3)
  • pegging (1)
  • pending (1)
  • Pentagon (1)
  • Pento (2)
  • permit (2)
  • personal (1)
  • Peter (13)
  • Peter Schiff (13)
  • petition (1)
  • Pfizer (1)
  • pharmaceutical (1)
  • phys (1)
  • physical (2)
  • piano (1)
  • PIIGS (6)
  • platinum (7)
  • PMI (11)
  • Ponzi (1)
  • Poor's (2)
  • population (1)
  • Portugal (3)
  • positions (3)
  • Potash (1)
  • Potemkin (1)
  • PPLT (1)
  • precious (4)
  • premium (25)
  • president (1)
  • Price (16)
  • private (1)
  • product (1)
  • production (7)
  • profit (1)
  • PSLV (5)
  • public (3)
  • purchasing (1)
  • QE (1)
  • QE3 (6)
  • radio (1)
  • rally (2)
  • rate (27)
  • rates (2)
  • ratio (11)
  • RBS (1)
  • real (4)
  • Real estate (4)
  • receipt (1)
  • recession (1)
  • recycling (1)
  • red (1)
  • referendum (1)
  • regions (1)
  • registered (3)
  • registered gold (1)
  • repatriation (1)
  • report (4)
  • requirement (1)
  • reserve (12)
  • reserve currency (1)
  • reserve requirement (1)
  • reserves (3)
  • Resource (1)
  • revenue (2)
  • revision (1)
  • revisions (1)
  • Rhodium (1)
  • Rickards (1)
  • RJA (1)
  • RMB (1)
  • Road (1)
  • Roche (1)
  • Royal Canadian Mint (1)
  • run (1)
  • Russia (2)
  • Sachs (1)
  • sales (1)
  • SAU (1)
  • Saudi Arabia (1)
  • Savings (5)
  • scheme (1)
  • Schiff (13)
  • Scott Minerd (1)
  • scrap (3)
  • second quarter (1)
  • sector (1)
  • securities (1)
  • Seminar (1)
  • sentiment (2)
  • SGS (1)
  • Shanghai (15)
  • share (1)
  • sheet (7)
  • SHIBOR (1)
  • short (6)
  • short positions (1)
  • shortage (2)
  • shorting (1)
  • Show (1)
  • Silva (1)
  • silver (90)
  • Silver glitch (1)
  • Silver Lake Resources (1)
  • Singapore (1)
  • single (1)
  • Sipef (1)
  • slv (3)
  • Societe general (1)
  • Soros (1)
  • soybean (1)
  • soybeans (1)
  • Spain (4)
  • Spain unemployment (1)
  • SpainC (1)
  • Spanish (1)
  • SPDR (1)
  • spending (2)
  • Spiegel (1)
  • SPPP (2)
  • SPR (1)
  • spread (1)
  • Sprott (14)
  • stand (1)
  • standard (3)
  • Standard and Poor's (5)
  • starts (1)
  • stimulus (2)
  • stock (19)
  • stocks (2)
  • strategic petroleum reserve (1)
  • Street (1)
  • stress (1)
  • Student (1)
  • sugar (1)
  • supply (5)
  • Supramax (1)
  • surplus (1)
  • surprise (1)
  • Swaps (1)
  • Swiss (2)
  • Switzerland (4)
  • takeover (1)
  • target (1)
  • tax (8)
  • taxation (1)
  • taxes (1)
  • Tekoa (1)
  • test (1)
  • testify (1)
  • The Real Crash (1)
  • Theory (2)
  • TLT (1)
  • total (4)
  • trade (1)
  • trade deficit (1)
  • transport (1)
  • treasuries (18)
  • treasury (10)
  • treasury holdings (2)
  • trust (3)
  • turbo (1)
  • Turk (5)
  • U.S. (21)
  • U.S. debt (1)
  • U.S. dollar (1)
  • U.S. Mint (2)
  • U.S. treasuries (1)
  • U.S. treasury holdings (1)
  • U3 (1)
  • U6 (1)
  • unemployment (17)
  • Unemployment rate (1)
  • united states (1)
  • up (1)
  • US (7)
  • USA (1)
  • USD (8)
  • Utilization (8)
  • Valcambi (1)
  • valuation (1)
  • Vegas (1)
  • velocity (5)
  • Visa (1)
  • volatility (1)
  • wage (3)
  • wages (1)
  • Wall (1)
  • Wall Street Journal (1)
  • War (3)
  • warehouse (1)
  • Warren (2)
  • wedge (1)
  • Western Potash (1)
  • wheat (2)
  • worker (1)
  • world (1)
  • World Market Window (1)
  • wrap (1)
  • WTI (1)
  • Yahoo (1)
  • year (2)
  • yen (2)
  • Yeul (1)
  • yield (11)
  • yields (2)
  • yuan (1)
  • zero (6)
  • Zero Hour (2)
  • Zero Hour Debt (1)
  • zerohedge (2)
  • zinc (1)

Blog Archive

  • ▼  2013 (243)
    • ▼  August (7)
      • GLD trust gold inflow?
      • Peter Schiff: Stand-Up Comedian
      • Gold Lease Rate Higher, Registered COMEX Gold Lower
      • The Declining Trade Deficit: Not As Rosy As You Wo...
      • China Gold Imports from Hong Kong: Steady in June ...
      • Tax Receipts Vs. Savings Rate
      • Gold Backwardation Explained By James Turk
    • ►  July (14)
    • ►  June (34)
    • ►  May (23)
    • ►  April (53)
    • ►  March (36)
    • ►  February (33)
    • ►  January (43)
  • ►  2012 (257)
    • ►  December (42)
    • ►  November (26)
    • ►  October (30)
    • ►  September (20)
    • ►  August (25)
    • ►  July (32)
    • ►  June (30)
    • ►  May (29)
    • ►  April (23)
Powered by Blogger.

About Me

Unknown
View my complete profile