UnidoRecruitingNATIONAL

  • Subscribe to our RSS feed.
  • Twitter
  • StumbleUpon
  • Reddit
  • Facebook
  • Digg
Showing posts with label correlation. Show all posts

Tuesday, 16 July 2013

Single Family Housing Starts Vs. Unemployment Rate

Posted on 09:15 by Unknown
One of the key metrics for the health in the housing market are the "privately owned housing starts". "Housing starts" are an economic indicator that reflect the number of privately owned new houses (technically housing units) on which construction has been started in a given period. Usually, a decline in the "housing starts" leads to the start of a recession. 


The "housing starts" are a leading indicator for the unemployment rate. Both metrics are inversely correlated. When the "housing starts" drop, the unemployment rate will rise with a lag of about 1 to 2 years.

Because of the fact that the "housing starts" are a leading indicator, this is a very important metric to predict the unemployment rate. As a consequence, the "housing starts" are also a predictor of real GDP, capacity utilization, the stock market index and the consumer price index (CPI).
Read More
Posted in correlation, family, Housing, rate, single, starts, unemployment | No comments

Monday, 15 July 2013

Correlation: Employment-Population Ratio Vs. Real GDP per Capita

Posted on 10:02 by Unknown
I like statistics that can't be fudged by the government and this is one of them: The Civilian Employment-Population Ratio. This measure is one of the best to evaluate the labor market. Each time when this ratio declines, we enter a recession. So this is a very good gauge in predicting bad periods in the overall economy.

A high ratio (above 70%) means that a lot of people are employed and this will result in a high GDP per capita. A low ratio (under 50%) is considered bad for GDP.


If we take a look at the percentage change per annum, we see that the trend for the employment-population ratio is down (blue chart). So the employment picture isn't improving and this translates into a declining real GDP per capita growth rate (red chart).


As Karl Denninger explains, the amount of employed people as a percentage of the population hasn't improved since 2008. So the economy hasn't recovered a lot.

Read More
Posted in capita, correlation, Denninger, Employment, gdp, Greg, Hunter, Karl, population, real | No comments

Wednesday, 3 July 2013

Correlation: Mortgage Rates Vs. Mortgage Applications Vs. Pending Home Sales

Posted on 13:47 by Unknown
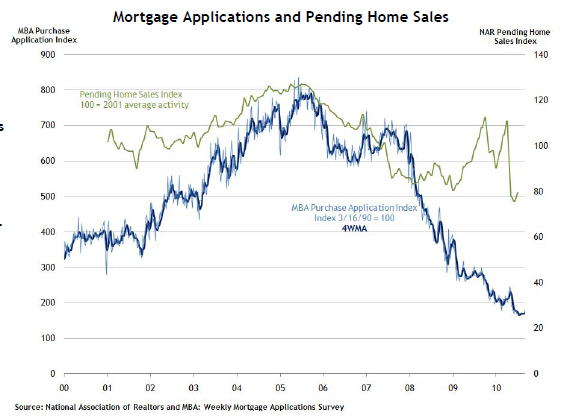
Just discovered another correlation on Zero Hedge. If mortgage rates go up, lending becomes more difficult, so people stop applying for new mortgages. This means there is a negative correlation between mortgage rates and mortgage applications.


When mortgage applications go down, not a lot of homes will be sold. This means that home sales will go down. As suggested by the following chart, there is a correlation here between mortgage applications and pending home sales.

If it's true that interest rates and mortgage rates will go up, you can bet that we will have another housing crisis. Home sales go down. All those homes will be coming onto the market, while nobody wants them.
Read More
Posted in applications, correlation, correlations, Hedge, home, mortgage, pending, rate, sales, zero | No comments

Thursday, 27 June 2013

Building Permits Vs. Housing Market

Posted on 10:35 by Unknown
The authorization of building permits is a leading indicator for the housing market. As you can see on this chart, the new private housing units authorized by building permits move first, while the house price index moves several months later. 

This way, you can predict the direction of the real estate market. 

On June 2013, the direction of the housing market is clearly upwards.

Read More
Posted in building, correlation, estate, Housing, index, market, permit, real | No comments

Correlation: Lumber Vs. Housing

Posted on 10:15 by Unknown
Apparently the lumber price is a leading indicator and a proxy for the housing market. (Zero Hedge)


If the lumber price goes up, 2 months later, the housing market goes up. The same happens the other way round.

So it's very important to watch the lumber price, which can be found here.
http://www.nasdaq.com/markets/lumber.aspx?timeframe=10y


And even more important, if this correlation is real, then you can just predict the market and earn money by betting on the direction of the market.

Read More
Posted in correlation, Housing, lumber | No comments

Tuesday, 4 June 2013

Correlation: S&P Revenues Vs. PMI

Posted on 11:24 by Unknown
Dr. Ed Yardeni's blog is a pool full of critical information and one of them is a newly discovered correlation which I will add to my collection.

Apparently the PMI is a leading indicator for the S&P revenues, which also means the PMI is a leading indicator for the overall direction of the stock market. This is consistent with the correlation between the PMI and the GDP, which is correlated to the total stock market index on itself via the Warren Buffet Rule.

So if you want to know the direction of the earnings of the financials, just look at the PMI and you can predict the trend, which is certainly down after the miss in PMI reported the previous week.
Chart 1: S&P 500 Revenues Vs. PMI
Read More
Posted in correlation, gdp, PMI, Standard and Poor's | No comments

Tuesday, 21 May 2013

Correlation: Gold/Silver Ratio Vs. S&P

Posted on 09:29 by Unknown
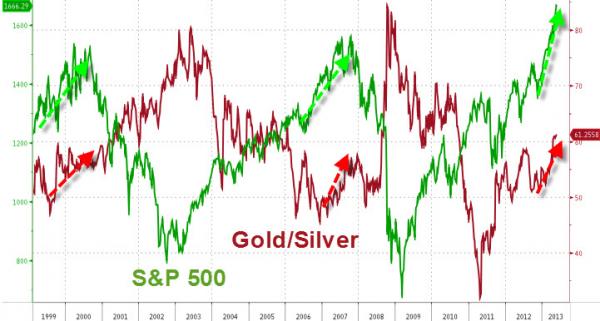
Zero Hedge thaught us another correlation. The Gold/Silver Ratio actually has a meaning.

When the ratio goes up, gold goes up more than silver, which means fear is growing. In that environment, the stock market declines. Conversely, when the gold/silver ratio declines, silver is stronger than gold, which means fear is going away and the risk-on trade is prevalent.

Another way to look at it is: when stock markets plunge, silver won't do well.

Chart 1: Gold/Silver Ratio Vs. S&P
So we have yet another tool to predict the stock markets. Just keep it in mind.

You can monitor the Gold/Silver ratio here:
http://stockcharts.com/freecharts/gallery.html?s=%24GOLD%3A%24SILVER
Read More
Posted in correlation, Gold, ratio, silver | No comments

Saturday, 18 May 2013

Correlation: Monitoring the GLD Trust ETF to Predict Gold Prices Based on Demand

Posted on 05:17 by Unknown
As demand is now being dictated for a part by the ETF's, we need to pay attention to what is happening in the trusts. Are they unloading their gold? Because if they keep unloading their gold, the demand from ETF's is going to decline, which has a negative impact on the gold price. This is the theory of supply and demand.

You can monitor this chart daily at the SPDR gold trust site:
http://www.spdrgoldshares.com/usa/historical-data/


Chart 1: GLD Trust: Units in the trust (tonnes)

As I indicated here, ETF's were the largest sellers in gold, resulting in a 13% decline in the demand for gold. I cannot stress how important it is that ETF's keep buying gold. If they don't buy, like what happened starting in 2013, then the price of gold will decline. The great difference between 2013 and 2008 is that in 2008, ETF's were massive buyers of gold, while today they are massive sellers. Keep watching this trend. If it reverses, you can confidently start buying precious metals
Read More
Posted in correlation, ETF, gld, Gold, SPDR, trust | No comments

Wednesday, 24 April 2013

Durable Goods Orders Vs. S&P

Posted on 13:11 by Unknown
This page is created to monitor the Durable Goods Orders Vs. S&P.

The durable goods orders are new orders placed with domestic manufacturers for delivery of factory hard goods.

If we see a plunge in durable goods orders (blue chart), we know for sure that in the months to come we won't see a lot of activity in factories as orders decline. There will be less work and that will reflect itself in the stock market,  in particular the S&P (red chart).

The durable goods orders chart is the less volatile of the two and should be a good indicator for the S&P, which is more volatile.

In recent months we see the durable goods orders flatten out, which means the S&P will likely decline in the coming months.

Read More
Posted in correlation, durable, goods, orders, Standard and Poor's | No comments

Sunday, 21 April 2013

Correlation: Gold Bottoms out on Marginal Cost of Suppliers

Posted on 01:56 by Unknown
The gold price has always followed the marginal cost of suppliers throughout history (Figure 1).
The correlation between gold prices and gold mining cash costs between 1980 and 2010 stood at 0.85, which is pretty highly correlated (Source: CPM Gold Yearbook 2011).

With the price of gold at $1400/ounce today I'm pretty sure we can't go much lower if this correlation proves to be correct (Chart 1).
Chart 1: Marginal cost suppliers of gold (Source: Eurekareport)

If we only look at the cash operating costs, we have this picture (Chart 2):

Chart 2: Production cash cost
Let's analyze these charts further. While cash operating costs only went up a little bit to $700/ounce (Chart 2), the total marginal cash costs went up to $1300/ounce in 2013 (Chart 1). So the biggest move in total cash cost came from overhead, discovery, construction and sustaining capital. In the 1980's, we see that cash operating costs contributed the most in the total cost of mining, but today, the biggest chunk of the costs go to overhead, discovery, construction and maintenance. A summary of the cost structure is given in chart 3.

Chart 3: Replacement cost for an ounce of gold
For investors, the key point to keep in mind is that cash operating costs aren't a good indicator for the gold price. You need to look at the overall costs of replacement and that includes all additional costs to mine gold. That total cost will dictate the price of gold.

I hear many analysts say that gold will go to $10000/ounce. I don't think this will happen soon, unless the total marginal cost goes up the same amount. This could happen when energy, labour, exploration, maintenance, construction costs go up or when ore grades go down. At the same time, some people say gold will go back below $1000/ounce. This is not possible because marginal cash costs are rising and we know that there is a high correlation between marginal cash costs and the gold price. 

The following chart is the most important chart every gold investor needs to be aware of. As I mentioned before, there is a high correlation between the all in cash costs of gold mining and the gold price (Chart 4).

Chart 4: All in Costs Vs. Gold Price
The gold price will therefore always follow the cost of mining which proves another important point. The rising gold price is an indicator of inflation because the higher cost of mining is a direct result of inflation.

Now consider the following. We see that many development stage gold mining companies have had increases in their exploration spending and many of these companies have had upward revisions in their feasibility studies. To name a few examples: Kinross Gold (KGC) and Novagold Resources (NG). So if capital spending on all of these projects go up, it isn't too difficult to see that the gold price will keep rising in the future.

Chart 5: Gold Exploration Spending


Read More
Posted in correlation, cost, Gold, marginal | No comments

Thursday, 18 April 2013

Correlation: Initial Unemployment Claims Vs. S&P

Posted on 11:46 by Unknown
Another way to value the stock market is to look at the initial unemployment claims. You take the inverted chart of this metric and you will see that this is highly correlated with the S&P index.
Chart 1: Initial Unemployment Claims (Inverted) Vs S&P Index
So whenever you hear that the initial unemployment claims went up, you sell the S&P index.

Oh, and what do you know, weekly initial unemployment claims just went up:
http://www.marketwatch.com/story/us-weekly-jobless-claims-edge-up-to-352000-2013-04-18?link=MW_latest_news
Read More
Posted in and, claims, correlation, initial, Poor's, standard, unemployment | No comments

Wednesday, 17 April 2013

COMEX Default Looming?

Posted on 15:03 by Unknown
The latest articles say that the LBMA, COMEX are going to default in the next few weeks. What is all this fuss about?

Apparently the open interest in silver is at record highs while the silver price is dropping. This is not normal because normally the open interest should decline. But let's first ask ourselves, what is open interest?

Open interest is the total number of options and futures contracts that are not closed on a particular day. If someone opens a call on silver on the futures market, then open interest increases by 1. If open interest is increasing at a rapid pace, that means there are a lot of traders on the futures market making calls (long) and puts (short).

The key metric to watch here is the following:
When open interest is increasing, it means that the price trend in silver will keep going up/down.
When open interest is decreasing, it means that the price trend in silver will reverse the trend.

So what do we have here? We have an increasing open interest in silver, with a declining silver price. That means the drop in silver price is likely to keep going lower as shorts are creating more and more short positions. Once the open interest trend changes, then we will see a reversal in the silver market to the upside.

Chart 1: Silver Open Intrest

So we have a huge battle in the market with a huge increase in short sellers. That increase in open interest is also found in the total stock at COMEX silver (Chart 2). You see the total stock in green is at record highs, while the real physical available silver in blue is not increasing. How can it be that we have so little physical silver in storage for delivery at the COMEX, while trading is so high? If somehow 10% of the longs start to ask for their silver delivery, the COMEX will default. And the chance of default will go up if the open interest keeps increasing. Keep watching the blue line (registered physical silver) as it goes down.

Chart 2: Silver COMEX

Read More
Posted in COMEX, correlation, default, Interest, LBMA, open, silver | No comments

Saturday, 30 March 2013

Correlation: Recession Vs. Yield Spread

Posted on 12:12 by Unknown
I came across an interesting article that gives an empirical correlation between the yield spread between the 10 year and 3 month treasuries/bill and the probability of a recession when that yield spread narrows.

The key is to monitor that the 10 year yield is always higher than the 3 month yield. If the 10 year yield starts to go closer to the 3 month yield and even goes below it, then we have a high probability of a recession.

That correlation can be witnessed on chart 1. Each time the blue line goes below zero, we have a recession.
Chart 1: Recession Vs. Yield Spread

The last recession was in 2008. A few years before, the yield spread went to zero. Today we're in pretty safe territory (Chart 2). The green line minus the black line is 2%. If we see the black line go up again or the green line go down, we are in trouble. That's why the Federal Reserve never will increase the fed funds rate. Otherwise the black line will spike upwards.

No problems today. But it pays off to watch the yield spread each month or so.

Chart 2: U.S. bond yields
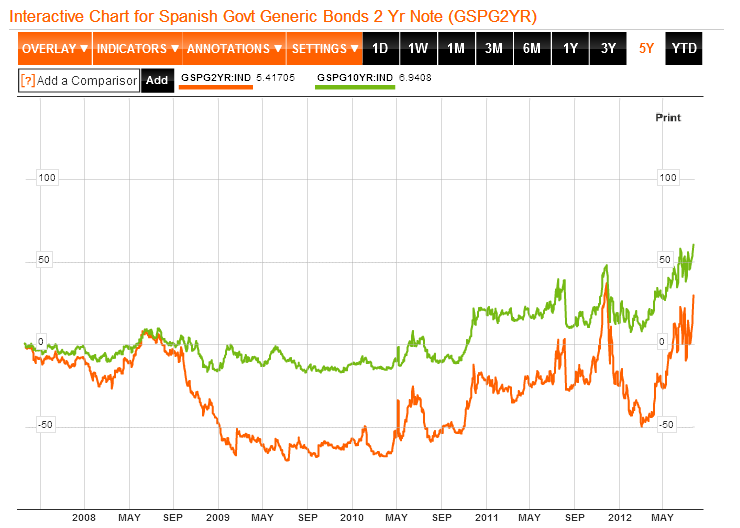
This theory is applicable to every country. I analyzed Spain for example in this article. 

Chart 3: Spanish Bond Yields (10 year vs 2 year)

Read More
Posted in correlation, correlations, recession, spread, yield | No comments

Friday, 22 March 2013

Correlation: 30 Yr. Treasury Yield Vs. 30 Yr. Mortgage Rates

Posted on 11:28 by Unknown
Just wanted to add another couple of correlations to my collection. We will learn about fixed and adjustable rate mortgages. These are correlated against treasury yields and fed funds rate respectively.

1) Conventional (Fixed) Mortgage Rate Vs. Treasury Yields
As you can see mortgage rates are always higher than treasury yields because U.S. treasuries are considered much safer than mortgages.
Chart 1: 30 Yr. Treasury Yield Vs. 30 Yr. Mortgage Rate
2) Adjustable Mortgage Rate Vs. Fed Funds Rate
Adjustable Rate Mortgages on the other hand are linked to the Fed Funds Rate.
Chart 2: 1 Yr. Adjustable Rate Mortgage Vs. Fed Funds Rate

Read More
Posted in 30, bond, correlation, mortgage, treasury, year, yield | No comments

Correlation: Disposable Income Vs. Housing Prices: Is there a housing bubble?

Posted on 10:17 by Unknown
Peter talked a lot about housing on the radio show of 21 March 2013. He said that house prices could drop a lot from here, but I don't agree with that.

To see where housing prices will go we need to look at 3 fundamentals. The most important one is wages and income. If your monthly disposable income doesn't match with the house you are buying, you will not be able to pay off your house. The second factor is mortgage rates. If you need to pay an ever increasing higher interest, you will have difficulties to pay off your house (at an adjustable rate mortgage). The last factor is savings. If you don't have a pool of savings, you can't make an adequate down payment for your house.

Let's analyze these 3 fundamentals in this article.

Read More
Posted in correlation, disposable, Housing, income, Price, wages | No comments

Thursday, 21 March 2013

List of All Discovered Correlations

Posted on 11:26 by Unknown

Once in a while I need to post an update on all discovered correlations, we're getting a huge list already. If I only had some software to get automatic updates of these charts...

Positive correlations mean that if one goes up, the other goes up too. Negative correlations mean that if one goes up, the other goes down.

Positive correlations:
1) Silver premium Vs. Silver Price 
2) Baltic Dry Vs. Industrial Commodities
3) Baltic Dry Vs. Copper
4) Copper Vs. S&P
5) Oil Vs. Dow Jones
6) Agriculture Price Vs. Health of Economy
7) Agriculture Vs. Fertilizer Price 
8) CRB Index Vs. Commodity prices (oil, agriculture, metals)
9) MZM velocity Vs. Inflation
10) MZM velocity Vs. 10 year U.S. treasury yield
11) Case-Shiller Index Vs. Housing Market Index
12) Capacity Utilization Vs. Inflation
13) Rhodium Price Vs. Automotive Industry
14) Housing Price Vs. Rise of Wages
15) O-metrix Score Vs. Stock Value
16) Outlay Spending Vs. Hyperinflation
17) Gold Money Index Vs. Gold Price
18) Stock Dividend to Bond Yield ratio Vs. Stock Price
19) War Vs. Silver Price
20) Exchange Rate Vs. Treasury Bond Valuation
21) PMI Vs. GDP Growth Rate
22) Gold Lease Rate Vs. Gold Price
23) Economy of Australia/Canada Vs. Industrial Commodities
24) Jim Sinclair's Fed Custodials Vs. Gold Price
25) LCNS silver net short positions Vs. Silver Price
26) ECB Deposit Rate Vs. Euribor and Deposit Facility
27) China Gold Imports from Hong Kong Vs. Gold Price
28) AUD/USD Vs. Iron Ore
29) Chinese yoy GDP growth Vs. Chinese yoy Power Consumption
30) Chinese yoy Power Consumption Vs. Chinese yoy Power Production
31) M1 and Gold
32) Obesity Vs. Debt
33) Global Equity Prices Vs. Global EPS revisions
34) Total Public Debt Vs. Interest Payment on Debt
35) U.S. Bond Yields Vs. Interest Payment on Debt
36) Federal Reserve Balance Sheet Vs. S&P
37) Federal Reserve Balance Sheet Vs. Gold Price
38) Balance Sheet Ratio Fed/ECB Vs. EUR/USD 
39) China Manufacturing PMI Vs. Base Metal Prices
40) COMEX stock level Vs. CFTC Open Interest
41) Manufacturing component of Industrial Production Vs. CRB Metals Index
42) Net Short Interest Gold Vs. Gold Price
43) Central Bank Net Gold Buying Vs. Gold Price
44) LCNS silver Vs. Silver Open Interest
45) Bond Yields Vs. Gold Price
46) Gold Miners Bullish Percent Index Vs. GDX
47) Daily Sentiment Index Gold Vs. Gold Price
48) Commercial Net Short Interest Vs. Silver Price
49) Food Stamp Participation Rate Vs. Unemployment Rate
50) Bitcoin Price Vs. Gold Price
51) Credit Expansion Vs. Economic Health (second link)
52) Gold Volatility Vs. Gold Price
53) Total Stock Market Index Vs. GDP
54) Brent Crude Oil Vs. WTI Crude Oil
55) EPS revisions Vs. P/E Ratio
56) Citigroup Surprise Index (CESI) Vs. S&P 
57) EPS revisions Vs. S&P
58) Dow Theory: Dow Jones Transportation Average Vs. Dow Jones Industrial Average
59) Margin Balance Vs. S&P
60) Federal Debt Growth Vs. 10 Year Treasury Yields
61) Fed Funds Rate Vs. 10 Year Treasury Yields
62) Total Central Bank Balance Sheet Vs. Gold Price
63) Large Commercial Short in Copper Vs. Copper Price
64) Bond Yields (<3%) Vs. P/E Ratio
65) ECB Lending (LTRO) Vs. Deposits at Banks
66) Disposable Income Vs. Housing Prices
67) Fixed (conventional) Mortgage Rate Vs. Treasury Yields
68) Adjustable Mortgage Rate Vs. Federal Funds Rate
69) Silver Vs. Bitcoin
70) Open Interest Trend Vs. Price Trend
71) Wage Inflation Vs. Consumer Price Index (CPI)
72) Marginal Cost of Gold Suppliers Vs. Gold Price (link 2)
73) Durable Goods Orders Vs. S&P
74) Gold ETF Trust (GLD) Vs. Gold Price
75) PMI (leading indicator) Vs. S&P Revenues
76) Federal Funds Rate Vs. LIBOR Rate
77) Lumber Price (leading indicator) Vs. Housing
78) Building Permits (leading indicator) Vs. Housing
79) Pending Home Sales Vs. Mortgage Applications
80) Employment-Population Ratio Vs. Real GDP per Capita

Negative correlations:
1) Copper Price Vs. Copper Futures Contango
2) Interest Rates (bond yields >3%) Vs. P/E ratio of gold mines
3) Non-Farm Payrolls Vs. Unemployment Rate
4) Federal Debt Held by Foreigners Vs. U.S. Bond Yields
5) Size of Governments Vs. Their Economies
6) Stocks Vs. U.S. Dollar
7) Silver Stock at CME Vs. Silver Price
8) China Reserve Requirements Vs. Shanghai Real Estate Prices
9) Capacity Utilization Vs. Unemployment Rate
10) Net Commercial Short Positions Vs. Bond Yields (Alternative Site)
11) Net Non-Commercial Long Positions Vs. Bond Yields
12) % Change in Gold Vs. Real Interest Rates on 10 Year Treasuries 
13) Shanghai Silver Premium Vs. Silver Price
14) Probability of Recession Vs. 10 year - 3 year Yield Spread
15) Junk Silver Premium Vs. Silver Price
16) Wage Inflation Vs. Unemployment Rate
17) Initial Unemployment Claims Vs. S&P
18) Gold/Silver Ratio Vs. S&P
19) GLD Flows Vs. Shanghai Gold Premium
20) Unemployment Rate Vs. Real GDP
21) Mortgage Rates Vs. Mortgage Applications
22) Single Family Housing Starts Vs. Unemployment Rate
23) Tax Revenue Vs. Personal Savings Rate

These are a lot of correlations that you need to monitor on a day to day basis!

Read More
Posted in correlation, correlations | No comments

Thursday, 7 March 2013

Correlation: P/E ratio Vs. Bond Yields

Posted on 09:00 by Unknown
A few months ago I said that the P/E ratio would go up when bond yields go down. Apparently today, I read on Zerohedge that it is not black and white. This is only true for yields above 3%.

When we go lower than 3%, the correlation reverses. This is very interesting...


Chart 1: Yields Vs. P/E Ratio

Read More
Posted in bond, correlation, P/E, ratio, yield | No comments

Monday, 4 March 2013

Correlation: Large Commercial Shorts in Copper Vs. Copper Price

Posted on 08:34 by Unknown
Just for Discerning Admirer I looked at the CFTC report for Dr. Copper.

The same correlations as in silver and gold can be found here. When large commercials go short, we hit a top in the copper price. When large commercials cover their shorts and go long, the copper price bottoms out.

In the most recent February 2013 smackdown of copper we see that a lot of shorts have covered their short positions in copper. The red bars were very negative (a lot of commercial short interest), but those negative red bars have now subsided back to zero.

That means I expect that the copper smackdown has run its course for now.

This report, together with the contango report should give us an idea of the trend in the copper price. I can't wait to see the contango report for tomorrow.

I emphasize: this is only an indicator for short term moves. For long term moves you should always look at the contango report. The contango report says we are still in contango, which means the copper price will go up.

Chart 1: CFTC Report Copper
Chart 2: Copper Price
PS: I haven't found a correlation between LME copper stock and copper price yet.
Read More
Posted in commercial, copper, correlation, Price, short | No comments

Sunday, 3 March 2013

Correlation: Total Central Bank Balance Sheet Vs. Gold Price

Posted on 01:12 by Unknown
I once said there was a correlation between the Federal Reserve balance sheet and the gold price. As a result there is also a correlation between M1 and the gold price. This is still the case.

But gold is universal, so you should look at the balance sheets of every central bank in the world.

Chart 1: Total Central Bank Assets
Even though the Federal Reserve balance sheet has been going up due to QE3, there is one central bank that did the opposite recently. That dreaded central bank is the ECB.

As you can see on Chart 2, the ECB has shrinked its balance sheet due to the repayment of LTRO. European banks paid off 137 billion euro on 25 January 2013. So you can see the dip here.

Chart 2: ECB Assets
That repayment of LTRO coincided with a rise in the EUR/USD (Chart 3).

Chart 3: EUR/USD

And a drop in gold price in euros.

Chart 4: Gold Price in Euro

So forget complacency in the Eurozone as reason for the dropping gold price. Just look at the balance sheet of the ECB as primary reason.

We may not forget that the ECB has one of the largest balance sheet in the world (after China) and we need to monitor their balance sheet even more than the Federal Reserve balance sheet. Japan should be monitored closely too.

You can monitor the ECB balance sheet here.
For the Japanese balance sheet you must google it.


Read More
Posted in banks, central, correlation, Gold | No comments

Thursday, 28 February 2013

Correlation: Margin Lending Vs. Stock Valuation

Posted on 14:02 by Unknown
I came across an interesting correlation: Margin Lending Vs. S&P.

Margin loans are programs that allow investors to borrow money to buy equities. So if you think through it: the higher the margin balance in the market, the higher the S&P will go, because people will have more borrowed money to put in the stock market. Today, the total margin balance is at $350 billion for NYSE member firms.

The evidence is presented on Chart 1. You can see that there is no lag between the two charts, so it's a rather useless correlation to time the market.

Chart 1: Margin Balance Vs. S&P
Although fairly useless, sometimes there are discrepancies that can be spotted. For example, the rising Australian stock market could be overvalued at this moment when you look at their declining margin lending rate (Chart 2). So it can be interesting to watch this correlation.

Chart 2: Margin Balance Vs. ASX200

Read More
Posted in balance, correlation, lending, margin | No comments
Older Posts Home
Subscribe to: Posts (Atom)

Popular Posts

  • GLD trust gold inflow?
    Looks like the media is telling us that the GLD trust physical gold holdings are rising and giving a boost to the precious metals prices. I ...
  • Eric Sprott Taking Silver Off The Market With Offering
    Yesterday, Eric Sprott priced a follow-on offering at $US 200 million, which is a 20% increase in its silver holdings. This will certainly i...
  • Copper Inventories Rising
    With the China PMI indicating a contraction in GDP growth (of which I talked about HERE ), another sign has emerged of China slowing down. T...
  • Peter Schiff: When Will It Hit The Fan?
    Here's an update from Peter.  The most important sentence in this video was about decoupling of the U.S. dollar and stock markets. Norma...
  • Silver Contango Vs. Silver Price?
    Just for fun I made the same contango chart for silver as I did for copper and had hoped something would come out of it. But surprisingly, t...
  • Correlation between Bonds and Gold
    Just to be sure that I have this picture (and correlation) logged onto this blog, here is the famous Zero Hedge bonds Vs. gold chart. Chart ...
  • ECB Rate Cut and its Effect on Euribor
    On Thursday 5 July 2012, the ECB cut its main refinancing rate to 0.75% and its deposit rates to 0%. After LTRO I and LTRO II, we have anoth...
  • The Current Status on Precious Metals
    Let's do a quick analysis on precious metals here. First off, I said yesterday that China lost interest in gold during the past months i...
  • Silver Lease Rates Jump To One Year High (and then fall back to where they were previously)
    Recently, the long term silver (PSLV) (SLV) lease rates jumped to a one year high since May 2011 (Chart 1). On 17 April 2012, the one year l...
  • Capacity utilization rate April 2012 79.2% above estimates
    In my previous article I pointed out how important it is to follow the capacity utilization rate to estimate the prices of gold and silver ...

Categories

  • 10 (1)
  • 10 year treasuries (1)
  • 1987 (1)
  • 2012 (7)
  • 30 (1)
  • account (1)
  • acquisitions (1)
  • adjustable (1)
  • ADP (1)
  • Advantage (1)
  • aggregates (2)
  • AGQ (1)
  • agriculture (1)
  • Akamai Technologies (1)
  • alert (1)
  • Alex Jones (1)
  • Allan Meltzer (1)
  • Allana (1)
  • Allana Potash (1)
  • amber gold (1)
  • America (1)
  • and (2)
  • Angela (1)
  • APMEX (5)
  • applications (1)
  • April 2012 (1)
  • arbitrage (2)
  • Arthur (1)
  • asia (2)
  • Asian (1)
  • At. Augustine Gold (1)
  • Atlantic Economy Summit (1)
  • AUD (1)
  • Australian dollar (1)
  • automotive (2)
  • average (3)
  • Avino (1)
  • bac (2)
  • backing (1)
  • backwardation (6)
  • balance (8)
  • balance sheet (3)
  • Baltic (1)
  • Baltic Dry Index (1)
  • Bank (10)
  • Bank of America (1)
  • Bankrupt (1)
  • bankruptcy (2)
  • banks (3)
  • bar (1)
  • Barclays (1)
  • Bargain (1)
  • Barrick Gold (1)
  • base (1)
  • base money (1)
  • Bass (1)
  • BCS (1)
  • beleggerscompetitie (4)
  • Belgium (10)
  • Ben (3)
  • Ben Bernanke (4)
  • Bernanke (4)
  • Bernstein (1)
  • BHP (1)
  • bitcoin (8)
  • blog (1)
  • BNP (1)
  • bond (14)
  • bond yields (1)
  • bonds (33)
  • boom (1)
  • Brad Cooke (1)
  • Brazil (1)
  • brent (2)
  • Brink's (2)
  • brother (1)
  • BrotherJohnF (1)
  • bubble (2)
  • budget (2)
  • Budget Deficit (1)
  • Buffett (2)
  • building (2)
  • bullion (1)
  • bullish (1)
  • buyback (1)
  • buying (1)
  • c (1)
  • calculation (2)
  • Cambridge (1)
  • Canada (1)
  • Capacity (8)
  • Capacity Utilization (7)
  • Capesize (1)
  • capita (1)
  • Capstone Mining (1)
  • car crash (1)
  • Case-Shiller (1)
  • Casey (1)
  • Cash is Trash (1)
  • cattle (1)
  • ceiling (4)
  • celente (2)
  • cement (1)
  • central (2)
  • CFTC (3)
  • Chaudhary (1)
  • Chicago (2)
  • China (48)
  • China Construction Bank (1)
  • CHK (1)
  • chocolate (1)
  • Citigroup (2)
  • city (1)
  • claims (3)
  • CLF (1)
  • cliff (3)
  • CME (11)
  • cnbc (2)
  • CNT depository (1)
  • coal (2)
  • cocoa (1)
  • COFER (2)
  • coffee (1)
  • comedy (1)
  • COMEX (33)
  • commercial (1)
  • Commerzbank (1)
  • commodities (4)
  • commodity (1)
  • competition (1)
  • composition (1)
  • Conan (1)
  • Conference (2)
  • congress (1)
  • consumer (4)
  • consumption (2)
  • Contango (26)
  • contraction (1)
  • convention (1)
  • copper (34)
  • copper contango (1)
  • corn (2)
  • Corp (1)
  • correlation (54)
  • correlations (7)
  • cost (5)
  • costs (1)
  • COT (4)
  • cotton (1)
  • council (1)
  • country (2)
  • county (1)
  • cover (1)
  • CPI (5)
  • crash (2)
  • CRB (3)
  • credit (2)
  • Credit Agricole (1)
  • Croatia (1)
  • crude (3)
  • currency (3)
  • current (1)
  • curve (1)
  • Cut (1)
  • Cyprus (7)
  • Da (1)
  • daily (1)
  • Dan Norcini (1)
  • David (1)
  • David Morgan (2)
  • DB (1)
  • de-peg (1)
  • Debt (30)
  • debt ceiling (2)
  • debt limit (1)
  • December (1)
  • decoupling (7)
  • default (4)
  • deficit (7)
  • deflation (2)
  • delivery (1)
  • Demand (6)
  • Denmark (2)
  • Denninger (1)
  • deposit (8)
  • deposit facility (1)
  • deposits (3)
  • diamond (1)
  • Discouraged (1)
  • disposable (1)
  • dividend (1)
  • DJP (1)
  • DNC (1)
  • dollar (2)
  • domestic (1)
  • Doug (1)
  • Dow (7)
  • drop (1)
  • Dry (1)
  • durable (1)
  • dwcf (1)
  • earnings (4)
  • earnings per share (1)
  • ECB (6)
  • economy (1)
  • Ecuador (1)
  • elections (1)
  • electricity (2)
  • eligible (2)
  • Embry (1)
  • Employment (1)
  • Endeavour (1)
  • Endeavour Silver (2)
  • Engelhard (1)
  • eps (3)
  • equities (3)
  • equity (1)
  • equity markets (1)
  • Eric (6)
  • Eric Sprott (1)
  • estate (2)
  • estimate (1)
  • ETF (3)
  • Ethiopia (1)
  • Ethiopian Potash (1)
  • eur (1)
  • Eureka (1)
  • Euribor (2)
  • euro (8)
  • Europe (7)
  • European Union (1)
  • Eurozone (1)
  • exchange (1)
  • EXK (1)
  • expansion (1)
  • experiment (4)
  • exploration (1)
  • export (1)
  • exports (1)
  • Exposure (1)
  • external (1)
  • Faber (3)
  • family (1)
  • Faustian (1)
  • fed (2)
  • federal (10)
  • federal reserve (3)
  • Fertilizer (1)
  • Financial Services Committee (1)
  • First (3)
  • First Majestic Silver Corp. (1)
  • fiscal (3)
  • fiscal cliff (1)
  • fixed (1)
  • food stamps (1)
  • food stamps hire people (1)
  • foreigners (4)
  • forex (1)
  • Forum (1)
  • forward (1)
  • franc (1)
  • France (3)
  • Fraser (1)
  • French (1)
  • fund (1)
  • funds (3)
  • gas (1)
  • Gazprom (1)
  • gdp (25)
  • George Soros (1)
  • Germany (3)
  • gld (3)
  • GNP (1)
  • GOFO (4)
  • Gold (130)
  • gold money index (1)
  • golden cross (1)
  • Goldman (1)
  • Goldman Sachs (2)
  • goldonomic (1)
  • goods (1)
  • got gold report (1)
  • government (2)
  • great (1)
  • Great Depression (2)
  • Greece (8)
  • Greg (1)
  • gross (1)
  • growth (1)
  • GS (1)
  • GSK (1)
  • Hampshire (1)
  • Hang Seng (1)
  • Happy New Year (1)
  • Hedge (1)
  • Hewlett Packard (1)
  • Hitler (1)
  • HMI (1)
  • holding (1)
  • holdings (4)
  • Hole (1)
  • Hollande (4)
  • home (1)
  • hong (7)
  • Hong Kong (11)
  • hour (4)
  • hourly (3)
  • Housing (8)
  • housing market index (1)
  • HSBC (1)
  • Hunter (1)
  • Hyperinflation (3)
  • IMF (1)
  • import (14)
  • imports (16)
  • income (1)
  • index (13)
  • India (1)
  • industrial (2)
  • industry (1)
  • inflatiion (1)
  • inflation (11)
  • iniflation (1)
  • initial (3)
  • initial claims (1)
  • initiative (1)
  • Insider (1)
  • insider trading (1)
  • institute (1)
  • interconnectivity (1)
  • Interest (9)
  • interest payment (1)
  • Interest Rates (1)
  • inventory (1)
  • investment (2)
  • Investor (1)
  • Iran (4)
  • Ireland (1)
  • Iron (2)
  • Iron ore (2)
  • Irwin (1)
  • Israel (2)
  • Italy (4)
  • J.P. Morgan (7)
  • J.P. Morgan Chase (1)
  • Jackson (1)
  • James (5)
  • James Turk (2)
  • Japan (10)
  • jesse jackson (1)
  • Jim (1)
  • Jim Rogers (1)
  • Jim Sinclair (1)
  • JNJ (1)
  • job cuts (1)
  • jobless (2)
  • John (3)
  • John Davis (1)
  • Jones (2)
  • JP Morgan (1)
  • jpm (1)
  • July (1)
  • June (2)
  • junk (3)
  • Karl (1)
  • keiser (2)
  • king world news (1)
  • Kohler (1)
  • kong (7)
  • KWN (2)
  • Kyle (1)
  • Kyle Bass (1)
  • laptop (1)
  • large commercial (1)
  • Las (1)
  • LBMA (3)
  • LCNS (9)
  • Lease (8)
  • Lease rate (3)
  • lease rates (2)
  • Lecture (1)
  • lending (1)
  • leverage (1)
  • Liberty (1)
  • LIBOR (3)
  • Lloyds (1)
  • LME (3)
  • Loans (1)
  • london (2)
  • long (1)
  • LTRO (3)
  • lumber (1)
  • M0 (1)
  • M1 (1)
  • M2 (1)
  • M3 (2)
  • Majestic (3)
  • Maloney (1)
  • manager (1)
  • manipulation (1)
  • Marc (3)
  • Marc Faber (11)
  • March (1)
  • margin (1)
  • marginal (4)
  • market (5)
  • Mastercard (1)
  • maturity (2)
  • Mauldin (1)
  • max (2)
  • max keiser (3)
  • May (1)
  • MBS (5)
  • Melvin (1)
  • merger (1)
  • Merkel (1)
  • metal (1)
  • metals (7)
  • Metdist (1)
  • MF global (1)
  • Michael (2)
  • Middle East (1)
  • Mike (1)
  • Mike Maloney (2)
  • miners (2)
  • mines (1)
  • Mining (4)
  • minister (1)
  • Mint (1)
  • monetary (1)
  • money (4)
  • Moneyshow (1)
  • monitoring (1)
  • Monitoring of decoupling (1)
  • Morgan (1)
  • Morgan Stanley (1)
  • mortgage (6)
  • Moustache (1)
  • moving average (1)
  • MZM (3)
  • natural (1)
  • Natural gas (3)
  • Neeraj (1)
  • Negative (3)
  • net (4)
  • Netherlands (2)
  • New (1)
  • News (1)
  • nickel (1)
  • Noel (1)
  • Nomura (2)
  • non farm payroll (1)
  • non-farm payroll (1)
  • NOS (1)
  • Novartis (1)
  • O'Brien (1)
  • obesity (1)
  • Occupy (1)
  • Offering (1)
  • oil (9)
  • oil embargo (1)
  • Okun (1)
  • olivut resources (1)
  • OLV (1)
  • Onion (1)
  • open (3)
  • orders (1)
  • ore (1)
  • outflow (1)
  • outlay (4)
  • outlays (1)
  • overnight (1)
  • P/B (1)
  • P/E (2)
  • palladium (4)
  • Pan American Silver (1)
  • Panamax (1)
  • paper (1)
  • Paulson (1)
  • payment (1)
  • payroll (3)
  • pegging (1)
  • pending (1)
  • Pentagon (1)
  • Pento (2)
  • permit (2)
  • personal (1)
  • Peter (13)
  • Peter Schiff (13)
  • petition (1)
  • Pfizer (1)
  • pharmaceutical (1)
  • phys (1)
  • physical (2)
  • piano (1)
  • PIIGS (6)
  • platinum (7)
  • PMI (11)
  • Ponzi (1)
  • Poor's (2)
  • population (1)
  • Portugal (3)
  • positions (3)
  • Potash (1)
  • Potemkin (1)
  • PPLT (1)
  • precious (4)
  • premium (25)
  • president (1)
  • Price (16)
  • private (1)
  • product (1)
  • production (7)
  • profit (1)
  • PSLV (5)
  • public (3)
  • purchasing (1)
  • QE (1)
  • QE3 (6)
  • radio (1)
  • rally (2)
  • rate (27)
  • rates (2)
  • ratio (11)
  • RBS (1)
  • real (4)
  • Real estate (4)
  • receipt (1)
  • recession (1)
  • recycling (1)
  • red (1)
  • referendum (1)
  • regions (1)
  • registered (3)
  • registered gold (1)
  • repatriation (1)
  • report (4)
  • requirement (1)
  • reserve (12)
  • reserve currency (1)
  • reserve requirement (1)
  • reserves (3)
  • Resource (1)
  • revenue (2)
  • revision (1)
  • revisions (1)
  • Rhodium (1)
  • Rickards (1)
  • RJA (1)
  • RMB (1)
  • Road (1)
  • Roche (1)
  • Royal Canadian Mint (1)
  • run (1)
  • Russia (2)
  • Sachs (1)
  • sales (1)
  • SAU (1)
  • Saudi Arabia (1)
  • Savings (5)
  • scheme (1)
  • Schiff (13)
  • Scott Minerd (1)
  • scrap (3)
  • second quarter (1)
  • sector (1)
  • securities (1)
  • Seminar (1)
  • sentiment (2)
  • SGS (1)
  • Shanghai (15)
  • share (1)
  • sheet (7)
  • SHIBOR (1)
  • short (6)
  • short positions (1)
  • shortage (2)
  • shorting (1)
  • Show (1)
  • Silva (1)
  • silver (90)
  • Silver glitch (1)
  • Silver Lake Resources (1)
  • Singapore (1)
  • single (1)
  • Sipef (1)
  • slv (3)
  • Societe general (1)
  • Soros (1)
  • soybean (1)
  • soybeans (1)
  • Spain (4)
  • Spain unemployment (1)
  • SpainC (1)
  • Spanish (1)
  • SPDR (1)
  • spending (2)
  • Spiegel (1)
  • SPPP (2)
  • SPR (1)
  • spread (1)
  • Sprott (14)
  • stand (1)
  • standard (3)
  • Standard and Poor's (5)
  • starts (1)
  • stimulus (2)
  • stock (19)
  • stocks (2)
  • strategic petroleum reserve (1)
  • Street (1)
  • stress (1)
  • Student (1)
  • sugar (1)
  • supply (5)
  • Supramax (1)
  • surplus (1)
  • surprise (1)
  • Swaps (1)
  • Swiss (2)
  • Switzerland (4)
  • takeover (1)
  • target (1)
  • tax (8)
  • taxation (1)
  • taxes (1)
  • Tekoa (1)
  • test (1)
  • testify (1)
  • The Real Crash (1)
  • Theory (2)
  • TLT (1)
  • total (4)
  • trade (1)
  • trade deficit (1)
  • transport (1)
  • treasuries (18)
  • treasury (10)
  • treasury holdings (2)
  • trust (3)
  • turbo (1)
  • Turk (5)
  • U.S. (21)
  • U.S. debt (1)
  • U.S. dollar (1)
  • U.S. Mint (2)
  • U.S. treasuries (1)
  • U.S. treasury holdings (1)
  • U3 (1)
  • U6 (1)
  • unemployment (17)
  • Unemployment rate (1)
  • united states (1)
  • up (1)
  • US (7)
  • USA (1)
  • USD (8)
  • Utilization (8)
  • Valcambi (1)
  • valuation (1)
  • Vegas (1)
  • velocity (5)
  • Visa (1)
  • volatility (1)
  • wage (3)
  • wages (1)
  • Wall (1)
  • Wall Street Journal (1)
  • War (3)
  • warehouse (1)
  • Warren (2)
  • wedge (1)
  • Western Potash (1)
  • wheat (2)
  • worker (1)
  • world (1)
  • World Market Window (1)
  • wrap (1)
  • WTI (1)
  • Yahoo (1)
  • year (2)
  • yen (2)
  • Yeul (1)
  • yield (11)
  • yields (2)
  • yuan (1)
  • zero (6)
  • Zero Hour (2)
  • Zero Hour Debt (1)
  • zerohedge (2)
  • zinc (1)

Blog Archive

  • ▼  2013 (243)
    • ▼  August (7)
      • GLD trust gold inflow?
      • Peter Schiff: Stand-Up Comedian
      • Gold Lease Rate Higher, Registered COMEX Gold Lower
      • The Declining Trade Deficit: Not As Rosy As You Wo...
      • China Gold Imports from Hong Kong: Steady in June ...
      • Tax Receipts Vs. Savings Rate
      • Gold Backwardation Explained By James Turk
    • ►  July (14)
    • ►  June (34)
    • ►  May (23)
    • ►  April (53)
    • ►  March (36)
    • ►  February (33)
    • ►  January (43)
  • ►  2012 (257)
    • ►  December (42)
    • ►  November (26)
    • ►  October (30)
    • ►  September (20)
    • ►  August (25)
    • ►  July (32)
    • ►  June (30)
    • ►  May (29)
    • ►  April (23)
Powered by Blogger.

About Me

Unknown
View my complete profile