This page is created to monitor the Money Zero Maturity Velocity (MZM velocity) Vs. 10 Year U.S. Treasuries.
Historically, both are correlated. If money velocity picks up (blue chart), 10 Year U.S. Treasury Yields will rise (red chart).


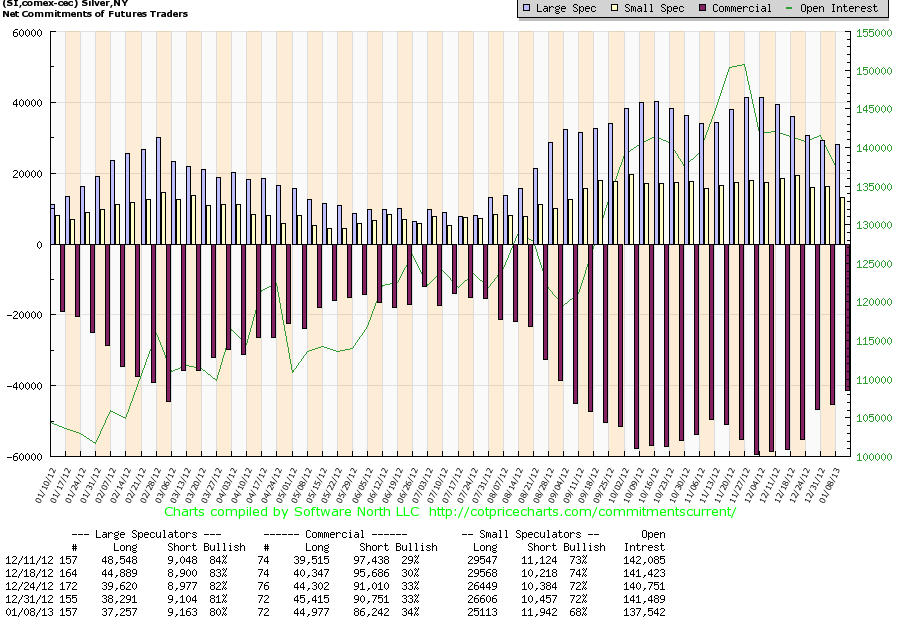 |
| Chart 1: Silver Open Interest |
 |
| Chart 2: Silver price |
 |
| Chart 3: 10 Year Treasuries Open Interest |
 |
| Chart 4: 10 Year Treasury Yields |
 |
| Chart 1: Commercial Open Interest in Treasury Notes |
 |
| Chart 2: 10 year U.S. bond yields |
 |
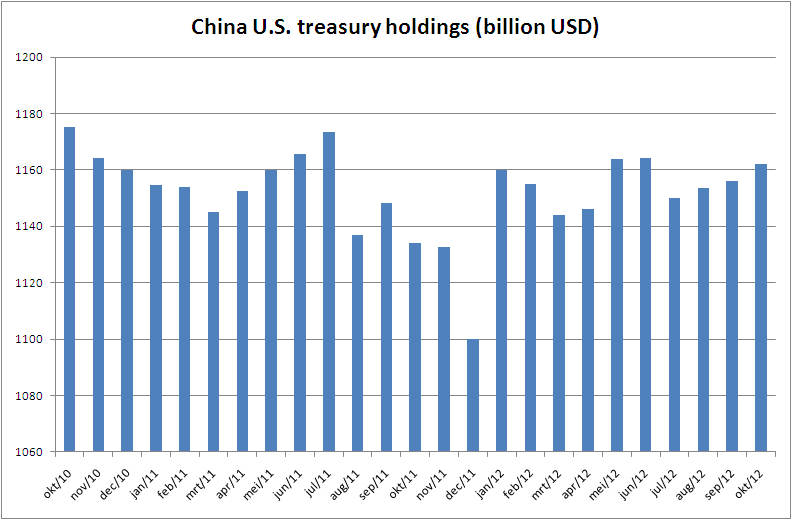
| Chart 1: China U.S. treasury holdings |
 |
| Chart 1: 10 year U.S. bond yield |
 |
 |
| Table 1: Foreign holdings of U.S. treasuries |
 |
| Chart 1: Percentage of Publicly Traded Federal Debt Held by Foreigners |
 |
| Chart 1: Detailed Federal Reserve Balance Sheet |
 |
| Chart 1: U.S. treasury debt by Year of Maturity (2011) |
 |
| Chart 3: 10 year U.S. treasury yield |
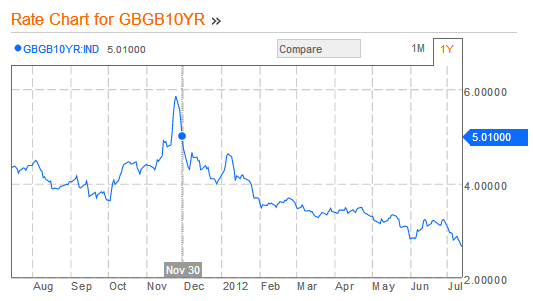 |
| Chart 1: Belgium 10 Year Government Bonds |
 |
| Chart 2: Belgium 10 Year Government Bonds |
 |
| Chart 1: Federal Reserve Balance Sheet |