


Showing posts with label Demand. Show all posts
Showing posts with label Demand. Show all posts
Friday, 21 June 2013


Saturday, 18 May 2013
Over the last few months, precious metals investors have seen their net worth decline due to declining precious metals prices (GLD), (SLV). A lot of this decline in precious metals prices was due to a decrease in demand, which was the result of selling by hedge funds as the World Gold Council reported here.
First quarter gold demand of 963 tonnes was down 13% compared with Q1 2012 due to an outflow in the total gold ETF holdings of 177 tonnes. 2013 marks the first year in a decade where ETF's are actually selling gold. While ETF holdings were reduced, this selling has been countered by an increase in physical demand for gold by China and India. Total demand in China rose 20% to 294 tonnes in Q1 2013 as compared to Q1 2012 (50 tonnes increase).
This huge increase in demand for physical gold can be witnessed on Chart 1, which gives the net imports of gold from Hong Kong to China.
While Chinese demand for gold was strong, Indian demand increased at an even higher pace. The Indian demand for gold increased 27% on the same quarter last year to 257 tonnes.
On the supply side we see a total increase of 1% in the first quarter of 2013 as compared to Q1 2012. Mine production increased 4% while recycling of gold decreased 4%.
So, the reason for the decline in precious metals prices is evident from an increase in supply (mine production increased) and a decrease in demand for gold (ETF outflows) (Chart 2). But there is an important point I need to make here. While the supply side is pretty constant at 1% increase, the demand side is the critical indicator we need to look at with its 13% decline. The decline was a result of hedge funds converting their gold holdings into equities. The Dow Jones (DIA) hit an all time high last week, fueled by a bullish prospect in the equity market of Japan, which on itself was a result of the massive Japanese monetary stimulus announced in April 2013. Although investors are cheering the bull market in equities, the macroeconomic conditions keep worsening. A few examples were a deterioration in PMI, capacity utilization, ISM manufacturing, vehicle sales, ADP employment, initial claims, PPI, mortgage applications, wages.
To see what this means for gold, read on here.
First quarter gold demand of 963 tonnes was down 13% compared with Q1 2012 due to an outflow in the total gold ETF holdings of 177 tonnes. 2013 marks the first year in a decade where ETF's are actually selling gold. While ETF holdings were reduced, this selling has been countered by an increase in physical demand for gold by China and India. Total demand in China rose 20% to 294 tonnes in Q1 2013 as compared to Q1 2012 (50 tonnes increase).
This huge increase in demand for physical gold can be witnessed on Chart 1, which gives the net imports of gold from Hong Kong to China.
 |
On the supply side we see a total increase of 1% in the first quarter of 2013 as compared to Q1 2012. Mine production increased 4% while recycling of gold decreased 4%.
(click to enlarge) 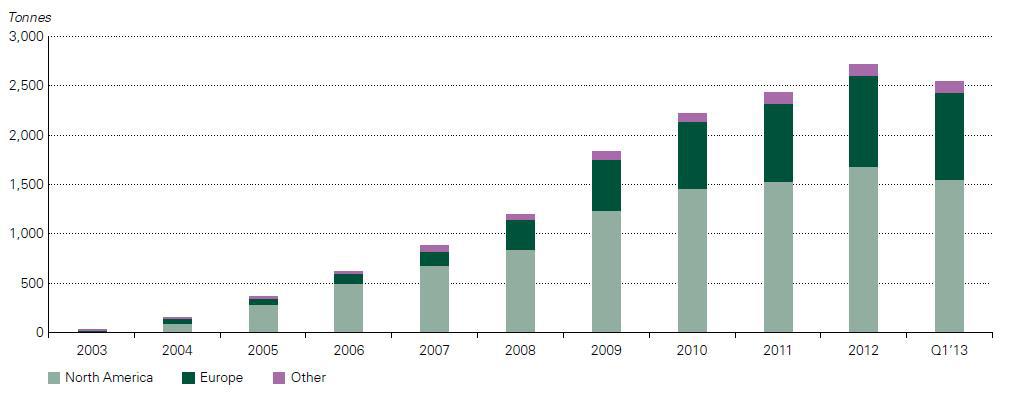 |
So, the reason for the decline in precious metals prices is evident from an increase in supply (mine production increased) and a decrease in demand for gold (ETF outflows) (Chart 2). But there is an important point I need to make here. While the supply side is pretty constant at 1% increase, the demand side is the critical indicator we need to look at with its 13% decline. The decline was a result of hedge funds converting their gold holdings into equities. The Dow Jones (DIA) hit an all time high last week, fueled by a bullish prospect in the equity market of Japan, which on itself was a result of the massive Japanese monetary stimulus announced in April 2013. Although investors are cheering the bull market in equities, the macroeconomic conditions keep worsening. A few examples were a deterioration in PMI, capacity utilization, ISM manufacturing, vehicle sales, ADP employment, initial claims, PPI, mortgage applications, wages.
To see what this means for gold, read on here.
Thursday, 14 February 2013
As I predicted here, the gold supply is declining by 1.4% in 2012 due to lower recycling. On the other hand, the gold demand from central banks soared.
It is odd that the gold price hasn't reacted on this yet.
The downward action this week in gold has much to do with the 1 week holiday in China. Fundamentals for gold look very good to me, at least on the demand supply side.
On a side note, APMEX silver premiums have gone to a new high of 16.5%. Very interesting.
It is odd that the gold price hasn't reacted on this yet.
The downward action this week in gold has much to do with the 1 week holiday in China. Fundamentals for gold look very good to me, at least on the demand supply side.
On a side note, APMEX silver premiums have gone to a new high of 16.5%. Very interesting.
 |
| Chart 1: APMEX premium on silver |
Monday, 7 January 2013
In a previous article I pointed out that the marginal cost of gold production including exploration, feasibility studies, construction, maintenance, production and taxes has doubled since 2009 up until now. That has placed a large burden on gold mining companies over this period. The result was a decline in the gold mining index (GDX) of around 10% since 2010. Even when the gold price steadily went up from $800 to $1600/ounce, there wasn't a lot of profit to be made by the gold mining companies themselves. This means that gold mining companies are very dependent on the gold price for their margins and profits. At the same time, I want to make a case that the gold price is also very dependent on the mining companies.
If anyone ever says that gold mining production isn't going to affect the gold price, you can use these charts to prove them wrong.
In 2012 we had 4000 tonnes of total gold supply per annum, while gold mine production was around 2812 tonnes per annum in 2012. That's a 70% interest of gold mine production as compared to the total gold supply.
If the gold miners continue to have lower prospects for production due to the marginal cost of production rising above the gold price (total marginal cost is currently $1500/ounce), then the supply of gold will drop. As a result we will see a rising effect on the gold price when this supply breaks down.
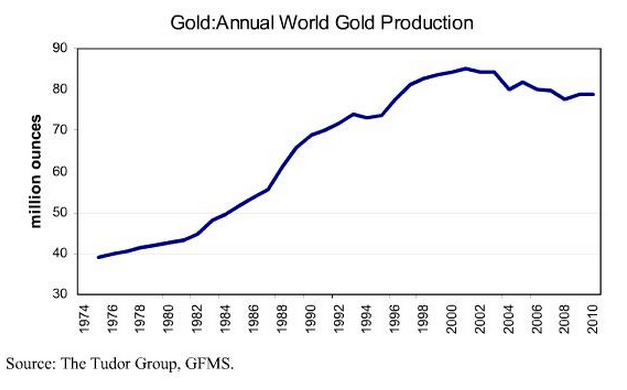
Mine supply had been going up since 1974 (Chart 1), but has peaked since year 2000. I believe mine supply is going to stay flat or even drop going forward due to decreasing ore grades and higher marginal costs of production.
To read more, go here.
If anyone ever says that gold mining production isn't going to affect the gold price, you can use these charts to prove them wrong.
In 2012 we had 4000 tonnes of total gold supply per annum, while gold mine production was around 2812 tonnes per annum in 2012. That's a 70% interest of gold mine production as compared to the total gold supply.
If the gold miners continue to have lower prospects for production due to the marginal cost of production rising above the gold price (total marginal cost is currently $1500/ounce), then the supply of gold will drop. As a result we will see a rising effect on the gold price when this supply breaks down.
Mine supply had been going up since 1974 (Chart 1), but has peaked since year 2000. I believe mine supply is going to stay flat or even drop going forward due to decreasing ore grades and higher marginal costs of production.
To read more, go here.
Sunday, 26 August 2012
Just a note to myself. Eric Sprott has got supply and demand numbers for gold out:
http://kingworldnews.com/kingworldnews/KWN_DailyWeb/Entries/2012/8/24_Sprott_-_We_Are_Staring_At_Chaos_%26_Collapse_In_Front_Of_Us.html
Gold Supply = 4000 tons/annum
Gold Demand = 6500 tons/annum
Gold Lease = 2500 tons/annum
We'll just have to find out what these numbers mean...
http://kingworldnews.com/kingworldnews/KWN_DailyWeb/Entries/2012/8/24_Sprott_-_We_Are_Staring_At_Chaos_%26_Collapse_In_Front_Of_Us.html
Gold Supply = 4000 tons/annum
Gold Demand = 6500 tons/annum
Gold Lease = 2500 tons/annum
We'll just have to find out what these numbers mean...
Sunday, 8 April 2012
With the China PMI indicating a contraction in GDP growth (of which I talked about HERE), another sign has emerged of China slowing down.
The LME Copper Warehouse Stocks Level has started a trend change and is actually rising (Chart 1). This build in inventories is probably indicating a slowing down the economy. A part of this build is due to Chinese markets staying shut for a public holiday on Wednesday 4 April 2012: Qing Ming Festival (清明节). Shanghai reopened on Thursday.
To see my analysis on this trend change go to Copper Demand and the Importance of China.
To see my analysis on this trend change go to Copper Demand and the Importance of China.
Subscribe to:
Posts (Atom)


