UnidoRecruitingNATIONAL

  • Subscribe to our RSS feed.
  • Twitter
  • StumbleUpon
  • Reddit
  • Facebook
  • Digg

Friday, 31 August 2012

The Effect of War on Silver

Posted on 11:32 by Unknown
Silver (PSLV, SLV) is one of the most thermally and electrically conductive materials on this world. Silver is also the best light reflecting element. Silver is being used for war equipment like aircraft and tank engines, automobiles,electrical connections, guns, torpedoes, radiator connections, rockets,warheads, submarines. In fact, silver is essential during wartime periods.

Silver-Investor.com points out:

"Notice that in a wartime period, silver use increases dramatically. In the nearly 63 years since that review was issued, no substitute has been found in nature for silver and its fantastic characteristics. Many revolutionary uses for silver were discovered as a consequence of war industry research, and what was true in 1942 is truer still today. A modern war machine MUST have silver to function at peak efficiency. Aerospace and jet aircraft technology could not exist without silver, nor could missiles and satellites. Countries which don't have adequate silver supplies are at serious strategic disadvantage in wartime, most likely to the point of being on the losing side."

It's no surprise that silver will go up during wartime.

The question is, how much will it go up?

First you need to understand that globally, the U.S. is the king in waging war (Figure 1). This is why I'll only focus on defense spending in the U.S.
Figure 1: Top 5 military spenders

The first big war started in 1860 and ended in 1865 (Civil War). Defense spending went up to 12% of GDP. The silver price went up dramatically from 1.292 $US/ounce to 2.939 $US/ounce. That's a 130% increase.

Next on, the two biggest World Wars of the 20th century were WWI and WWII. Defense spending during this wartime period similarly spiked upwards.

During WWI, we had a peak of 18% defense spending as a % of GDP. That caused the silver price to rise from 0.5 $US/ounce to 1.34 $US/ounce. That's a 170% increase. During WWII, which started in 1939 and ended in 1945, caused defense spending to go to 37% of GDP (Chart 2). As a result of this, the silver price went from 0.35 $US/ounce to 0.81 $US/ounce (Chart 1). That's a 130% increase.
(click to enlarge)
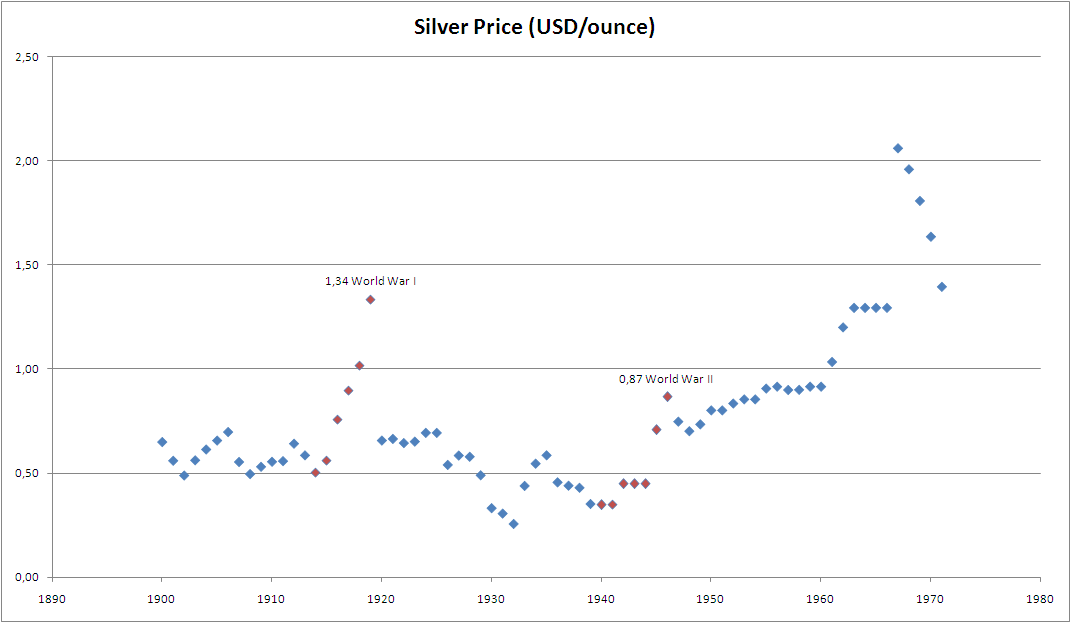
Chart 1: Silver Price During WWI and WWII
Chart 2: Defense Spending during WWI and WWII

After these three big wars, there hasn't been much activity other than the Vietnamese war from 1955 to 1975, which is of a much smaller magnitude (10 times smaller). To have a significant increase in the silver price though (specifically due to war), annual defense spending would need to at least go above 10% of GDP, or $US 1.5 trillion/annum.

Today, U.S. defense spending is at 6%, of which the war in Iraq and Afghanistan are the most costly. To date the U.S. already spent $US 1.4 trillion on these two wars. Liveleak is estimating the cost of the Iraq-Afghanistan war in the amount of $US 4 trillion. The Iraq-Afghanistan war is coming to an end though, as the U.S. has announced plans to reduce its presence in Iraq and Afghanistan.

The next significant war coming up would undoubtedly be the Iranian war, which could cost trillions of dollars. This war could start as early as in November 2012 as Michael Pento pointed out on his weekly Pento Portfolios Strategies update on 30 August 2012. Israel is likely to strike Iran's nuclear sites before the November elections. Trend forecasters like Gerald Celente have said just recently how this Iranian war could lead to the start of WWIII. The reason is that China and Russia are in support of Iran. China especially depends on oil imports from Iran (11% of Chinese oil is imported from Iran) and is defying the U.S. sanctions on Iran. These events have already create geopolitical tensions. In June 2012, the four countries: Syria, Russia, China and Iran were rallying troops along the Syrian coast, preparing for war-games in the Middle East. Today, several Iranian and Chinese warships/submarines are settled along the Syrian coast, ready to protect Assad's forces in Syria against any NATO intervention. Russia has already abandoned Syria to avoid getting caught up in the escalating crisis.

If this WWIII were to happen, the next significant spike in U.S. defense spending could eventually come to fruition. Investors can speculate on this outcome by buying Proshares Ultra Silver (AGQ).
Read More
Posted in correlation, Iran, Israel, silver, War | No comments

Wednesday, 29 August 2012

Another Correlation: What is China's Real Growth Rate?

Posted on 11:13 by Unknown
In the last week of August, Marc Faber gave a signal that all is not well in China. He points out that the Chinese statistics of 7% growth are inflated to the upside. There is a big chance for a hard landing to come in China because many statistics point to a significant slowing of the Chinese economy. For example, in July, industrial production declined sharply (Chart 1).

Chart 1: China Industrial Production (yoy)
It is very important to know that commodity prices are completely dependent on the growth of China as China is the biggest consumer of commodities in the world. If for example, the U.S. slows down 10%, it would be completely meaningless and wouldn't have any influence on the price of commodities. The reason is that the U.S. GDP consists for 80% of services, which don't use any commodities (Figure 1), while China's GDP consists only for 44% of services (Figure 2). So all eyes should be on China for the commodity investor.

Figure 1: Composition of U.S. GDP
Figure 2: Composition of GDP
So what is the best way to find the real growth of China?

Find out in the full version of this article.
Read More
Posted in China, consumption, correlation, electricity, gdp, production | No comments

Tuesday, 28 August 2012

Got Gold Report August 26: Gold/Silver moving upwards

Posted on 10:13 by Unknown
Got Gold Report has put out another report: http://www.youtube.com/watch?v=PjkDiavXLTg

Interesting to know is that the LCNS for gold is moving upwards again, indicating a higher price for gold (and silver) in the future.

Chart 1: Gold LCNS (Got Gold Report)


Silver is doing even better (Chart 2).

Chart 2: Silver LCNS (Got Gold Report)

Read More
Posted in got gold report, LCNS, silver | No comments

Monday, 27 August 2012

Correlation: Australian Dollar Vs. Iron Ore

Posted on 09:26 by Unknown
Another correlation to add to our list:

Positive correlation between AUD/USD Vs. Iron Ore price.

=> http://brazilianbubble.com/chart-the-correlation-between-iron-ore-price-and-the-australian-dollar/

Very important correlation to trade on. If you see a disparity like this:


You can bet that either iron ore prices will go up, or the Australian dollar will go down. So you can just put your money in both bets, you always win.

Reasoning? If you bet the iron ore price goes up and you bet the Australian dollar goes down you will at least get it right for one of the two. It can't be that the gap widens in the correlation, the gap always narrows to the equilibrium point. If iron ore prices do go down, you will at least make money on the Australian dollar plunging.

I call this the power of trading on correlation disparity.
Read More
Posted in AUD, Australian dollar, correlation, Iron, Iron ore | No comments

Sunday, 26 August 2012

Gold: Supply and Demand

Posted on 11:28 by Unknown
Just a note to myself. Eric Sprott has got supply and demand numbers for gold out:
http://kingworldnews.com/kingworldnews/KWN_DailyWeb/Entries/2012/8/24_Sprott_-_We_Are_Staring_At_Chaos_%26_Collapse_In_Front_Of_Us.html

Gold Supply = 4000 tons/annum
Gold Demand = 6500 tons/annum
Gold Lease = 2500 tons/annum

We'll just have to find out what these numbers mean...
Read More
Posted in Demand, Eric, Gold, Sprott, supply | No comments

Keith Fitz-Gerald and Chris Martenson on Japan

Posted on 05:20 by Unknown
Keith Fitz-Gerald talks about Japan in this interview with Chris Martenson.


The problem in Japan is its enormous government debt, which is 250% of GDP. Its population is very old, 30% of the population is going to die by 2050 and there are very few newborns.

He expects the yen to fall due to these dire prospects (200 USD/yen), but notes that the only reason why the yen (and the dollar) are so strong these days is because these two currency markets are the only markets big enough to absorb all this safety haven liquidity (listen at 28:00). More so, Europe has been the event that made investors flee in Japan and the U.S., giving them a little more time to kick the can.
Read More
Posted in Japan | No comments

Saturday, 25 August 2012

Euro Vs. USD: Take Two

Posted on 05:57 by Unknown
5 months after I wrote the article about the Euro Vs. the USD, it looks like the USD has won the match against the euro. Since April 2012, the euro has lost 5% against the USD. Let's look at what has changed in those months.

Following list gives the most important indicators for the future of a currency:
  • Current account balance of the country
  • Total national debt of the country
  • Inflation rate
  • Interest rate
If the current account balance of the country is positive, a country will export more than it imports. As the population of the country exports more, they will receive more foreign money. This money will then be converted into their own currency, which is then spent or put in their banks. As the foreign money is converted into the money of the country's population their own currency will appreciate in value.

The larger the national debt of the country, the more expensive it will be to sell debt to foreigners. The government will then be obliged to monetize this debt to keep interest rates low and to be able to service this debt. Rising debt load will therefore devalue the currency.

The higher the inflation rate, the lower the currency will go. An example is Vietnam, where the dong lost much of its value due to high inflation.

When interest rates are lower than the inflation rate, there is no incentive for foreigners to buy the currency. There is no incentive to save money. The consequence is a lower currency value.

Let's look at the current statistics:

1) Current account
5 months ago, the current account deficit of the US was in the order of $US 110 billion per quarter, which amounted to $US 450 billion per year (2011).

For the Eurozone, the 12-month cumulated seasonally adjusted current account recorded a deficit of EUR 44.9 billion.

Today, the eurozone is posting a current account surplus of 14.9 billion euro in June, while the U.S. is increasing its quarterly deficits to $US 137 billion in the latest quarter.

So in this case, the eurozone is still the winner.

Europe VS USA: 1-0.
Euro Area Current Account (Million euro)


U.S. Current Account (Billion USD)
2) Total National Debt
Total US national debt is $US 16 trillion. Total eurozone national debt to GDP is 88.6%, the GDP is $US 17.578 trillion in 2011, which translates to $US 15.6 trillion in Eurozone debt. So again, Europe wins by a small margin.

Europe VS USA: 2-0

3) Inflation Rate
5 months ago, the inflation rate in the Eurozone was 2.6%, while the inflation rate in the U.S. was 2.9%. Today the inflation rate in the Eurozone is 2.4%, while the inflation rate in the U.S. is 1.4%. This is a significant and surprising decline in inflation rate in the U.S Vs. Europe.

Europe VS USA: 2-1.
Euro Area Inflation Rate
U.S. Inflation Rate


4) Interest Rate
5 months ago, the interest rate in the Eurozone was 1%, while the interest rate in the US was essentially zero. As we already know, Mario Draghi lowered interest rates to 0.75%, but this is still higher than the interest rate in the U.S. (0.25%). Europe VS USA: 3-1
Euro Area Interest Rate

U.S. Interest Rate
     

Conclusion: Europe still wins by 3-1 against the USA, but is losing ground through inflation. Though I think the current account surplus of Europe is the most important positive indicator of the strength of the euro in the future.

Read More
Posted in account, current, Debt, euro, gdp, inflation, Interest, rate, USD | No comments

Summary of All Discovered Correlations

Posted on 03:36 by Unknown
I have found many correlations since I started blogging in January 2012. I'm really surprised at the amount of correlations I found.

So I wanted to summarize all correlations in this post. Positive correlations mean that if one goes up, the other goes up too. Negative correlations mean that if one goes up, the other goes down.

Positive correlations:
1) Silver premium Vs. Silver Price 
2) Baltic Dry Vs. Industrial Commodities
3) Baltic Dry Vs. Copper
4) Copper Vs. S&P
5) Oil Vs. Dow Jones
6) Agriculture Price Vs. Health of Economy
7) Agriculture Vs. Fertilizer Price 
8) CRB Index Vs. Commodity prices (oil, agriculture, metals)
9) MZM velocity Vs. Inflation
10) MZM velocity Vs. 10 year U.S. treasury yield
11) Case-Shiller Index Vs. Housing Market Index
12) Capacity Utilization Vs. Inflation
13) Rhodium Price Vs. Automotive Industry
14) Housing Price Vs. Rise of Wages
15) O-metrix Score Vs. Stock Value
16) Outlay Spending Vs. Hyperinflation
17) Gold Money Index Vs. Gold Price
18) Stock Dividend to Bond Yield ratio Vs. Stock Price
19) War Vs. Silver Price
20) Exchange Rate Vs. Treasury Bond Valuation
21) PMI Vs. GDP Growth Rate
22) Gold Lease Rate Vs. Gold Price
23) Economy of Australia/Canada Vs. Industrial Commodities
24) Jim Sinclair's Fed Custodials Vs. Gold Price
25) LCNS silver net short positions Vs. Silver Price
26) ECB Deposit Rate Vs. Euribor and Deposit Facility
27) China Gold Imports from Hong Kong Vs. Gold Price
28) AUD/USD Vs. Iron Ore
29) Chinese yoy GDP growth Vs. Chinese yoy Power Consumption
30) Chinese yoy Power Consumption Vs. Chinese yoy Power Production
31) M1 and Gold
32) Obesity Vs. Debt
33) Global Equity Prices Vs. Global EPS revisions
34) Total Public Debt Vs. Interest Payment on Debt
35) U.S. Bond Yields Vs. Interest Payment on Debt
36) Federal Reserve Balance Sheet Vs. S&P

Negative correlations:
1) Copper Price Vs. Copper Futures Contango
2) Interest Rates Vs. P/E ratio of gold mines
3) Non-Farm Payrolls Vs. Unemployment Rate
4) Federal Debt Held by Foreigners Vs. U.S. Bond Yields
5) Size of Governments Vs. Their Economies
6) Stocks Vs. U.S. Dollar
7) Silver Stock at CME Vs. Silver Price
8) China Reserve Requirements Vs. Shanghai Real Estate Prices

These are a lot of correlations that you need to monitor on a day to day basis!

Read More
Posted in correlation, economy | No comments

Belgium: Real Estate Starts Falling

Posted on 01:29 by Unknown
I live in Belgium and follow the real estate market closely. I said previously that Belgium's housing is in a housing bubble. Now that prediction starts to come true. We already knew that in the first quarter, real estate was dropping. Today we have new numbers and we see that Flanders is continuing with its drop in apartment prices. Also construction site costs are falling.

Goldman Sachs is saying Belgium real estate is 60% overvalued. That means prices are still to fall 40% in the future.

We already see how the sales are doing, not good (Chart 1).
Chart 1: Home Sales in Belgium

Read More
Posted in Belgium, bubble, Real estate | No comments

Scott Minerd: The Faustian Bargain

Posted on 01:11 by Unknown
To add more credence to the importance of interest rates on the assets of the federal reserve (and the banks) I will point to this article of Scott Minerd: The Faustian Bargain.

He says that it only takes a rise of 1% in interest rates to render the fed insolvent.

"Now, a 100 basis-point increase in interest rates would cause the market value of the Federal Reserve’s assets to fall by about 8% or approximately $200 billion which would leave the Federal Reserve with a capital deficit of $150 billion, rendering it insolvent under Generally Accepted Accounting Principles (GAAP)."

So I wasn't talking BS when I said interest rates are very important for the assets of the federal reserve and the bank's balance sheet. When interest rates rise, bad things happen.

Another thing to point out is that during high inflation (Table 1: purple blocks), bonds are the worst investment as bonds won't act well in inflationary times. Farmland, gold and silver on the other hand are good performers. And as Marc Faber always points out, art and collectibles will do especially well.

Chart 1: Outperformance comparison (art, stocks, farmland, gold, silver, bonds)

Read More
Posted in Bargain, bonds, Faustian, iniflation, Interest Rates, Scott Minerd, yields | No comments

Friday, 24 August 2012

Non-Farm Payrolls and Unemployment: Another Correlation

Posted on 15:11 by Unknown
I came across an interesting Zerohedge article about the odds of QE3. In that article they point out that QE3 odds are based on unemployment rate and non-farm payroll numbers, which will be released in about two weeks.

Table 1: Zerohedge's odds table for QE3
Actually, I think this table is redundant because a rise in payrolls (Chart 1) always accompanies a decline in unemployment rate. We will need the chart of the working-age population (Chart 2) to perform the analysis.

I will tell you the details, in this article.


Chart 1: Non-farm payrolls
Chart 2: Working-age Population in the U.S.

Read More
Posted in correlation, non farm payroll, payroll, unemployment | No comments

Analyzing Federal Debt held by Foreigners

Posted on 11:18 by Unknown
As U.S. treasury yields (TBT, TLT) are starting to spike upwards, investors should pay more attention to this new trend. To help investors monitor U.S. treasury yields I'll point out another interesting correlation between U.S. debt held by foreigners and U.S. bond yields. We will see they are inversely correlated. If foreigners sell U.S. bonds, bond yields will go up.

The total public debt consists of two components:

1) Debt held by the public which is $US 11.177 trillion today.
2) Intragovernmental debt which is $US 4.783 trillion today.

The sum of these two is almost $US 16 trillion. The debt held by the public is increasing very rapidly, while the intragovernmental debt is stable.
Of these two components, the first one can be held by foreigners.

To see the foreign holdings you can go to this site: Treasury.gov.

Table 1: Foreign holdings of U.S. treasuries

Avondale Asset Management has recently updated the percentage debt that foreigners held on in April 2012. They put up chart 1: Percentage of Publicly Traded Federal Debt Held by Foreigners.

Chart 1: Percentage of Publicly Traded Federal Debt Held by Foreigners
To read the full analysis, go here.
Read More
Posted in bonds, correlation, Debt, external, foreigners, treasuries, US | No comments

Thursday, 23 August 2012

Marc Faber: Middle East Conference 2012

Posted on 08:46 by Unknown
At long last, Marc Faber showed up again on a conference. This time it's the Middle East Hedge Funds World Conference 2012.

Enjoy!


Read More
Posted in Conference, Marc Faber, Middle East | No comments

Wednesday, 22 August 2012

A Detailed Federal Reserve Balance Sheet

Posted on 10:07 by Unknown
Just by having heated (and uncomfortable) discussions with seekingalpha commenters I learn new things. This is what you get when you write financial articles without any financial background.

But there are positive things coming from discussions.
Today I found a very nice interactive chart to follow the Federal Reserve's balance sheet (Chart 1).
You can play with the interactive chart here:
http://clevelandfed.org/research/data/credit_easing/index.cfm
Chart 1: Detailed Federal Reserve Balance Sheet
And what's very interesting is that the federal reserve has massively increased their treasury holdings. It's no wonder that bond yields are going down in the market. It won't be long when the federal reserve's balance sheet consists only of treasuries and mortgage backed securities, which are the most risky assets in the world.
Read More
Posted in balance, federal, MBS, mortgage, reserve, sheet, treasuries | No comments

Tuesday, 21 August 2012

The Simplified Bank Stress Test

Posted on 10:40 by Unknown
Bloomberg reported on 20 August 2012 that banks are stepping up their U.S. treasury buying. As deposits increased 3.3% to $US 8.88 trillion in the two months ended July 31 2012, business lending rose 0.7% to $US 7.11 trillion, Federal Reserve data show. This inherently means that banks aren't lending money to the private sector, but are lending their money to the U.S. government. Peter Schiff pointed this out on the Peter Schiff Show of 20 August 2012. Banks bought $US 136.4 billion in bonds (TLT) already this year, pushing their holdings to $US 1.84 trillion.

Let's take a snapshot of the debt maturities in 2011 and 2012 and quickly compare them (Chart 1 and  Chart 2: U.S. treasury debt by Year of Maturity (2012) ) (I talked about debt maturities in this article).

Chart 1: U.S. treasury debt by Year of Maturity (2011)


Chart 3: 10 year U.S. treasury yield 
You can immediately see that short term debt has doubled in 1 year time. The biggest buyers of these treasuries were the federal reserve, domestic investors, banks, emerging markets like Japan and China. It's no wonder that bond yields have gone down with all this buying of U.S. treasuries. But these yields have started to rise sharply just recently, topping 1.85% for the 10 year U.S. treasuries (Chart 3).

If you want to know what impact this will have on the banks, go read the full version of this article.
Read More
Posted in bac, Bank, Bank of America, bonds, Interest, MBS, rate, stress, test, treasuries, yield | No comments

Saturday, 18 August 2012

Silver Inventories at CME and Lease Rates

Posted on 03:26 by Unknown
Just a few weeks after I turned bullish on silver, articles are sprouting out of nowhere about silver inventories being historically low.

http://kingworldnews.com/kingworldnews/KWN_DailyWeb/Entries/2012/8/17_Expect_Major_Silver_Price_Spike_As_COMEX_Inventories_Decline.html

However, I see signs of a temporary weakness in silver.

1) The silver stocks at the CME aren't actually going down anymore. They are going upwards (Chart 1).

Chart 1: Silver Stocks CME
2) The silver lease rates are actually going down, instead of going up. Historically, when silver lease rates plunge, the price of silver will go down a few months later.

Chart 2: Silver Lease Rate
Conclusion: I would be wary about the price of silver. If this trend continues this way, look out below!
Read More
Posted in CME, COMEX, Lease, rates, silver, stock | No comments

China U.S. Treasury Holdings Steady in June 2012

Posted on 01:59 by Unknown
Nothing special has been reported in Chinese U.S. treasury holdings. The amount of U.S. treasuries held by China are almost unchanged at $US 1.164 trillion.

http://www.china.org.cn/video/2012-08/16/content_26252410.htm

Chart 1: Chinese U.S. treasury holdings

Read More
Posted in bonds, China, holdings, treasury, U.S. | No comments

Wednesday, 15 August 2012

Capacity Utilization highest since April 2008

Posted on 10:33 by Unknown
Good news for inflationists!

Capacity utilization for July 2012 came in at 79.3 (up from 78.9 a month ago), which is the highest number since April 2008. That also means we are nearing the danger zone of 80. Once we get above 80, you can bet that we will get high inflation after a few months from now.

All different industries were higher in capacity utilization with the mining industry posting an astounding 90.4 capacity utilization rate in July 2012, up from 89.5 a month ago.

There is absolutely no indication that precious metals won't go higher in the future.

Chart 1: Capacity Utilization

Read More
Posted in 2012, Capacity, inflatiion, July, Utilization | No comments

Tuesday, 14 August 2012

Amber Gold, another MF Global

Posted on 22:55 by Unknown
This is very important news. It seems that more and more ponzi schemes are showing themselves. Gerald Celente already lost in the millions when he bought paper gold (which was to be delivered in physical a few months later). Now Amber Gold isn't going to pay back their customers as reported by Zerohedge.

It's reported that 7000 people lost their money and may not ever get it back, or only a percentage of it.

I recommend everyone to start asking for physical delivery of gold, because this is going to worsen in the future. Only pay cash when you get your piece of physical gold in your hand.

On another note, Soros and Paulson increased their positions in GLD yet again. Soros more than doubled his position compared to a few months ago.
Read More
Posted in amber gold, celente, Gold, MF global, Ponzi, scheme | No comments

Comparing the Dow Jones and Shanghai Composite against Europe

Posted on 12:19 by Unknown
Over the last few years after the 2008 crisis, I want to give a performance update for the Dow Jones vis a vis the Shanghai Stock Exchange. The Dow Jones has gone up 50% after the 2008 stock market plunge (Chart 1), while the Shanghai Stock Exchange has gone up first, but essentially lost all of its gains in the period between 2010 and 2012 (Chart 2).

Indeed, many economists have pointed out that the U.S. stock market has outperformed almost every market in the world. Marc Faber pointed this out in a recent interview on Bloomberg Radio.
Chart 1: Dow Jones Industrial Average

Chart 2: Shanghai Stock Exchange Composite Index
I want to analyze this further. How can there be such disparity? It can't be the exchange rate between the USD and the CNY, because the Chinese yuan has only gone up 5% against the USD between 2008 and 2012. So what are the reasons?

Let's take a look at the basic market metrics: P/E, dividends, book value in the full version of this article.

Read More
Posted in China, dividend, Europe, P/B, P/E, Shanghai, USA | No comments

China Gold Imports drop another 10% in June 2012

Posted on 10:12 by Unknown
China Gold Imports have dropped another 10% from the previous month.

Although we see decreasing demand from China for gold, China says it will keep buying more this year as the precious metals market is set to grow throughout the second half of this year. Analysts say physical demand is still strong.

China Gold Imports from Hong Kong June 2012
Chart 1: China gold imports from Hong Kong

Instead, China is buying more and more U.S. treasuries.
China US treasury holdings May 2012
Chart 2: China U.S. treasury holdings

Read More
Posted in 2012, China, Gold, Hong Kong, import, imports, June | No comments

Thursday, 9 August 2012

Update on Silver Net Short Positions: LCNS

Posted on 11:03 by Unknown
On Monday 6th of August, the Financial Times leaked the news that the silver manipulation probe is likely to be dropped by the CFTC. It turned out that this news was premature. One of the 5 CFTC commissioners, Bart Chilton, said on 08 August 2012 that the investigation will continue as silver manipulation did occur. The silver manipulation probe was initiated in 2008 following a number of allegation of silver manipulation. Bart Chilton already found evidence of silver manipulation in 2010 and intends to search for additional evidence of this manipulation of the silver price.

How this all connects to the CFTC's LCNS numbers of July 2012, you can find out here.

Chart 1: LCNS Positions


Read More
Posted in CFTC, LCNS, net, positions, short, silver | No comments

Tuesday, 7 August 2012

China Outperforms Anyone

Posted on 12:07 by Unknown
Charts do tell us something. 

For example, when we plot the GDP of the top 20 countries in the world in a nice stacked area chart, we can clearly see that no other country than China has significant positive GDP growth. At this growth pace, it will only take 5 more years before China becomes the largest economy of the world on a country by country basis.

Yes, only 5 years! Because GDP growth may be denominated in percentage terms (which seem to be constant), but those percentage terms accumulate each year to the principal number.

Just imagine this event happening...

Chart 1: GDP of top 20 countries

Read More
Posted in China, gdp | No comments

Sunday, 5 August 2012

Biggest drop in U.S. bonds in 2 months

Posted on 06:43 by Unknown
A little update on the decoupling experiment I started 2 months ago. I wanted to see if the S&P could decline together with a decline in U.S. bonds and the U.S. dollar. This would mean each graph (red, green, blue) on chart 1 would go down. It hasn't started doing that yet.

What I did want to take note of is the big decline in U.S. bonds (green graph). On Friday 3 August, 10 year U.S. bond yields spiked to a 1.563% yield. This is almost a 10 basispoints rise in yield. Probably people are worried about the massive U.S. debt, which went to a record 15.933 trillion dollars from 14.8 trillion dollars a few weeks earlier.

The debt ceiling of 16.3 trillion (to be heightened to 16.7 trillion) is near. I predict this debt will go up even faster because no QE3 has been implemented, which means yields will go up and as a consequence interest payments on debt will go up as well.

Chart 1: Monitoring of decoubling USD vs. bonds vs. stocks

Read More
Posted in bonds, ceiling, Debt, decoupling, experiment, monitoring, yield | No comments

Friday, 3 August 2012

Merger and Acquisition (M&A) activity is growing in silver mining

Posted on 02:27 by Unknown
In a previous article I pointed out how bright the future is for silver. For example, one of my predictions is slowly coming to fruition. Chart 1 shows how the total silver stock (green dots) is starting to decline, indicating signs of increasing silver demand (or decreasing supply). Even the registered silver (blue dots) has started to decline just recently.

Chart 1: CME Silver Stock

The silver price has been forming a base around $US 27/ounce in the latest months (Chart 2).

Chart 2: Silver Price
As a result of this positive development in silver, several mining companies have shown Merger and Acquisition (M&A) activity in the silver sector.

I'll discuss companies like Pan American Silver Corporation, High River Gold, Liberty Silver Corp., RX gold and silver, U.S. Silver, Vista gold, Endeavour Silver and Kinross Gold.

To read the article go here.


Read More
Posted in acquisitions, merger, miners, silver, takeover | No comments
Newer Posts Older Posts Home
Subscribe to: Posts (Atom)

Popular Posts

  • The Current Status on Precious Metals
    Let's do a quick analysis on precious metals here. First off, I said yesterday that China lost interest in gold during the past months i...
  • J.P. Morgan Converts Almost Half of Eligible Gold to Registered Gold
    I couldn't believe my eyes when I saw this. Suddenly we saw the J.P. Morgan vault get almost half of the eligible gold converted into re...
  • Silver Inventories at CME and Lease Rates
    Just a few weeks after I turned bullish on silver , articles are sprouting out of nowhere about silver inventories being historically low . ...
  • China May 2012 Gold Imports from Hong Kong Still in an Uptrend
    A little update on China's gold imports from Hong Kong. For May 2012, China imported 75.6 metric tons from Hong Kong . Pretty disappoint...
  • China Construction Bank to Buy European Bank: RBS or Commerzbank?
    On 16 September 2012, China Construction Bank  (CCB) announced that it would use up to $15 billion dollars to buy a stake (30%-50% stake or ...
  • No U.S. Deficit in December 2012
    The U.S. has done a good job in the month of December 2012. Its outlays of $270 billion were fully absorbed by receipts of $270 billion whic...
  • Premiums on silver skyrocket
    With the 10% smackdown of silver today, the premiums on junk silver skyrocketed to 25% (Chart 1). The disconnect between the physical market...
  • The Declining Trade Deficit: Not As Rosy As You Would Think
    The trade deficit numbers are out for June 2013 and have been very positive. Due to an oil boom, the trade deficit shrank 22% from around $4...
  • Denmark: Negative Interest Rates
    It's amazing that central banks actually started to send key interest rates below 0%. Denmark just put the key interest rate to -0.2%.  ...
  • How to calculate profit on government bonds? Case Study on Belgian Bonds
    A couple months ago, Belgium sold government bonds to the public . For example 10 year bonds at 5%. I'm living in Belgium, so I took thi...

Categories

  • 10 (1)
  • 10 year treasuries (1)
  • 1987 (1)
  • 2012 (7)
  • 30 (1)
  • account (1)
  • acquisitions (1)
  • adjustable (1)
  • ADP (1)
  • Advantage (1)
  • aggregates (2)
  • AGQ (1)
  • agriculture (1)
  • Akamai Technologies (1)
  • alert (1)
  • Alex Jones (1)
  • Allan Meltzer (1)
  • Allana (1)
  • Allana Potash (1)
  • amber gold (1)
  • America (1)
  • and (2)
  • Angela (1)
  • APMEX (5)
  • applications (1)
  • April 2012 (1)
  • arbitrage (2)
  • Arthur (1)
  • asia (2)
  • Asian (1)
  • At. Augustine Gold (1)
  • Atlantic Economy Summit (1)
  • AUD (1)
  • Australian dollar (1)
  • automotive (2)
  • average (3)
  • Avino (1)
  • bac (2)
  • backing (1)
  • backwardation (6)
  • balance (8)
  • balance sheet (3)
  • Baltic (1)
  • Baltic Dry Index (1)
  • Bank (10)
  • Bank of America (1)
  • Bankrupt (1)
  • bankruptcy (2)
  • banks (3)
  • bar (1)
  • Barclays (1)
  • Bargain (1)
  • Barrick Gold (1)
  • base (1)
  • base money (1)
  • Bass (1)
  • BCS (1)
  • beleggerscompetitie (4)
  • Belgium (10)
  • Ben (3)
  • Ben Bernanke (4)
  • Bernanke (4)
  • Bernstein (1)
  • BHP (1)
  • bitcoin (8)
  • blog (1)
  • BNP (1)
  • bond (14)
  • bond yields (1)
  • bonds (33)
  • boom (1)
  • Brad Cooke (1)
  • Brazil (1)
  • brent (2)
  • Brink's (2)
  • brother (1)
  • BrotherJohnF (1)
  • bubble (2)
  • budget (2)
  • Budget Deficit (1)
  • Buffett (2)
  • building (2)
  • bullion (1)
  • bullish (1)
  • buyback (1)
  • buying (1)
  • c (1)
  • calculation (2)
  • Cambridge (1)
  • Canada (1)
  • Capacity (8)
  • Capacity Utilization (7)
  • Capesize (1)
  • capita (1)
  • Capstone Mining (1)
  • car crash (1)
  • Case-Shiller (1)
  • Casey (1)
  • Cash is Trash (1)
  • cattle (1)
  • ceiling (4)
  • celente (2)
  • cement (1)
  • central (2)
  • CFTC (3)
  • Chaudhary (1)
  • Chicago (2)
  • China (48)
  • China Construction Bank (1)
  • CHK (1)
  • chocolate (1)
  • Citigroup (2)
  • city (1)
  • claims (3)
  • CLF (1)
  • cliff (3)
  • CME (11)
  • cnbc (2)
  • CNT depository (1)
  • coal (2)
  • cocoa (1)
  • COFER (2)
  • coffee (1)
  • comedy (1)
  • COMEX (33)
  • commercial (1)
  • Commerzbank (1)
  • commodities (4)
  • commodity (1)
  • competition (1)
  • composition (1)
  • Conan (1)
  • Conference (2)
  • congress (1)
  • consumer (4)
  • consumption (2)
  • Contango (26)
  • contraction (1)
  • convention (1)
  • copper (34)
  • copper contango (1)
  • corn (2)
  • Corp (1)
  • correlation (54)
  • correlations (7)
  • cost (5)
  • costs (1)
  • COT (4)
  • cotton (1)
  • council (1)
  • country (2)
  • county (1)
  • cover (1)
  • CPI (5)
  • crash (2)
  • CRB (3)
  • credit (2)
  • Credit Agricole (1)
  • Croatia (1)
  • crude (3)
  • currency (3)
  • current (1)
  • curve (1)
  • Cut (1)
  • Cyprus (7)
  • Da (1)
  • daily (1)
  • Dan Norcini (1)
  • David (1)
  • David Morgan (2)
  • DB (1)
  • de-peg (1)
  • Debt (30)
  • debt ceiling (2)
  • debt limit (1)
  • December (1)
  • decoupling (7)
  • default (4)
  • deficit (7)
  • deflation (2)
  • delivery (1)
  • Demand (6)
  • Denmark (2)
  • Denninger (1)
  • deposit (8)
  • deposit facility (1)
  • deposits (3)
  • diamond (1)
  • Discouraged (1)
  • disposable (1)
  • dividend (1)
  • DJP (1)
  • DNC (1)
  • dollar (2)
  • domestic (1)
  • Doug (1)
  • Dow (7)
  • drop (1)
  • Dry (1)
  • durable (1)
  • dwcf (1)
  • earnings (4)
  • earnings per share (1)
  • ECB (6)
  • economy (1)
  • Ecuador (1)
  • elections (1)
  • electricity (2)
  • eligible (2)
  • Embry (1)
  • Employment (1)
  • Endeavour (1)
  • Endeavour Silver (2)
  • Engelhard (1)
  • eps (3)
  • equities (3)
  • equity (1)
  • equity markets (1)
  • Eric (6)
  • Eric Sprott (1)
  • estate (2)
  • estimate (1)
  • ETF (3)
  • Ethiopia (1)
  • Ethiopian Potash (1)
  • eur (1)
  • Eureka (1)
  • Euribor (2)
  • euro (8)
  • Europe (7)
  • European Union (1)
  • Eurozone (1)
  • exchange (1)
  • EXK (1)
  • expansion (1)
  • experiment (4)
  • exploration (1)
  • export (1)
  • exports (1)
  • Exposure (1)
  • external (1)
  • Faber (3)
  • family (1)
  • Faustian (1)
  • fed (2)
  • federal (10)
  • federal reserve (3)
  • Fertilizer (1)
  • Financial Services Committee (1)
  • First (3)
  • First Majestic Silver Corp. (1)
  • fiscal (3)
  • fiscal cliff (1)
  • fixed (1)
  • food stamps (1)
  • food stamps hire people (1)
  • foreigners (4)
  • forex (1)
  • Forum (1)
  • forward (1)
  • franc (1)
  • France (3)
  • Fraser (1)
  • French (1)
  • fund (1)
  • funds (3)
  • gas (1)
  • Gazprom (1)
  • gdp (25)
  • George Soros (1)
  • Germany (3)
  • gld (3)
  • GNP (1)
  • GOFO (4)
  • Gold (130)
  • gold money index (1)
  • golden cross (1)
  • Goldman (1)
  • Goldman Sachs (2)
  • goldonomic (1)
  • goods (1)
  • got gold report (1)
  • government (2)
  • great (1)
  • Great Depression (2)
  • Greece (8)
  • Greg (1)
  • gross (1)
  • growth (1)
  • GS (1)
  • GSK (1)
  • Hampshire (1)
  • Hang Seng (1)
  • Happy New Year (1)
  • Hedge (1)
  • Hewlett Packard (1)
  • Hitler (1)
  • HMI (1)
  • holding (1)
  • holdings (4)
  • Hole (1)
  • Hollande (4)
  • home (1)
  • hong (7)
  • Hong Kong (11)
  • hour (4)
  • hourly (3)
  • Housing (8)
  • housing market index (1)
  • HSBC (1)
  • Hunter (1)
  • Hyperinflation (3)
  • IMF (1)
  • import (14)
  • imports (16)
  • income (1)
  • index (13)
  • India (1)
  • industrial (2)
  • industry (1)
  • inflatiion (1)
  • inflation (11)
  • iniflation (1)
  • initial (3)
  • initial claims (1)
  • initiative (1)
  • Insider (1)
  • insider trading (1)
  • institute (1)
  • interconnectivity (1)
  • Interest (9)
  • interest payment (1)
  • Interest Rates (1)
  • inventory (1)
  • investment (2)
  • Investor (1)
  • Iran (4)
  • Ireland (1)
  • Iron (2)
  • Iron ore (2)
  • Irwin (1)
  • Israel (2)
  • Italy (4)
  • J.P. Morgan (7)
  • J.P. Morgan Chase (1)
  • Jackson (1)
  • James (5)
  • James Turk (2)
  • Japan (10)
  • jesse jackson (1)
  • Jim (1)
  • Jim Rogers (1)
  • Jim Sinclair (1)
  • JNJ (1)
  • job cuts (1)
  • jobless (2)
  • John (3)
  • John Davis (1)
  • Jones (2)
  • JP Morgan (1)
  • jpm (1)
  • July (1)
  • June (2)
  • junk (3)
  • Karl (1)
  • keiser (2)
  • king world news (1)
  • Kohler (1)
  • kong (7)
  • KWN (2)
  • Kyle (1)
  • Kyle Bass (1)
  • laptop (1)
  • large commercial (1)
  • Las (1)
  • LBMA (3)
  • LCNS (9)
  • Lease (8)
  • Lease rate (3)
  • lease rates (2)
  • Lecture (1)
  • lending (1)
  • leverage (1)
  • Liberty (1)
  • LIBOR (3)
  • Lloyds (1)
  • LME (3)
  • Loans (1)
  • london (2)
  • long (1)
  • LTRO (3)
  • lumber (1)
  • M0 (1)
  • M1 (1)
  • M2 (1)
  • M3 (2)
  • Majestic (3)
  • Maloney (1)
  • manager (1)
  • manipulation (1)
  • Marc (3)
  • Marc Faber (11)
  • March (1)
  • margin (1)
  • marginal (4)
  • market (5)
  • Mastercard (1)
  • maturity (2)
  • Mauldin (1)
  • max (2)
  • max keiser (3)
  • May (1)
  • MBS (5)
  • Melvin (1)
  • merger (1)
  • Merkel (1)
  • metal (1)
  • metals (7)
  • Metdist (1)
  • MF global (1)
  • Michael (2)
  • Middle East (1)
  • Mike (1)
  • Mike Maloney (2)
  • miners (2)
  • mines (1)
  • Mining (4)
  • minister (1)
  • Mint (1)
  • monetary (1)
  • money (4)
  • Moneyshow (1)
  • monitoring (1)
  • Monitoring of decoupling (1)
  • Morgan (1)
  • Morgan Stanley (1)
  • mortgage (6)
  • Moustache (1)
  • moving average (1)
  • MZM (3)
  • natural (1)
  • Natural gas (3)
  • Neeraj (1)
  • Negative (3)
  • net (4)
  • Netherlands (2)
  • New (1)
  • News (1)
  • nickel (1)
  • Noel (1)
  • Nomura (2)
  • non farm payroll (1)
  • non-farm payroll (1)
  • NOS (1)
  • Novartis (1)
  • O'Brien (1)
  • obesity (1)
  • Occupy (1)
  • Offering (1)
  • oil (9)
  • oil embargo (1)
  • Okun (1)
  • olivut resources (1)
  • OLV (1)
  • Onion (1)
  • open (3)
  • orders (1)
  • ore (1)
  • outflow (1)
  • outlay (4)
  • outlays (1)
  • overnight (1)
  • P/B (1)
  • P/E (2)
  • palladium (4)
  • Pan American Silver (1)
  • Panamax (1)
  • paper (1)
  • Paulson (1)
  • payment (1)
  • payroll (3)
  • pegging (1)
  • pending (1)
  • Pentagon (1)
  • Pento (2)
  • permit (2)
  • personal (1)
  • Peter (13)
  • Peter Schiff (13)
  • petition (1)
  • Pfizer (1)
  • pharmaceutical (1)
  • phys (1)
  • physical (2)
  • piano (1)
  • PIIGS (6)
  • platinum (7)
  • PMI (11)
  • Ponzi (1)
  • Poor's (2)
  • population (1)
  • Portugal (3)
  • positions (3)
  • Potash (1)
  • Potemkin (1)
  • PPLT (1)
  • precious (4)
  • premium (25)
  • president (1)
  • Price (16)
  • private (1)
  • product (1)
  • production (7)
  • profit (1)
  • PSLV (5)
  • public (3)
  • purchasing (1)
  • QE (1)
  • QE3 (6)
  • radio (1)
  • rally (2)
  • rate (27)
  • rates (2)
  • ratio (11)
  • RBS (1)
  • real (4)
  • Real estate (4)
  • receipt (1)
  • recession (1)
  • recycling (1)
  • red (1)
  • referendum (1)
  • regions (1)
  • registered (3)
  • registered gold (1)
  • repatriation (1)
  • report (4)
  • requirement (1)
  • reserve (12)
  • reserve currency (1)
  • reserve requirement (1)
  • reserves (3)
  • Resource (1)
  • revenue (2)
  • revision (1)
  • revisions (1)
  • Rhodium (1)
  • Rickards (1)
  • RJA (1)
  • RMB (1)
  • Road (1)
  • Roche (1)
  • Royal Canadian Mint (1)
  • run (1)
  • Russia (2)
  • Sachs (1)
  • sales (1)
  • SAU (1)
  • Saudi Arabia (1)
  • Savings (5)
  • scheme (1)
  • Schiff (13)
  • Scott Minerd (1)
  • scrap (3)
  • second quarter (1)
  • sector (1)
  • securities (1)
  • Seminar (1)
  • sentiment (2)
  • SGS (1)
  • Shanghai (15)
  • share (1)
  • sheet (7)
  • SHIBOR (1)
  • short (6)
  • short positions (1)
  • shortage (2)
  • shorting (1)
  • Show (1)
  • Silva (1)
  • silver (90)
  • Silver glitch (1)
  • Silver Lake Resources (1)
  • Singapore (1)
  • single (1)
  • Sipef (1)
  • slv (3)
  • Societe general (1)
  • Soros (1)
  • soybean (1)
  • soybeans (1)
  • Spain (4)
  • Spain unemployment (1)
  • SpainC (1)
  • Spanish (1)
  • SPDR (1)
  • spending (2)
  • Spiegel (1)
  • SPPP (2)
  • SPR (1)
  • spread (1)
  • Sprott (14)
  • stand (1)
  • standard (3)
  • Standard and Poor's (5)
  • starts (1)
  • stimulus (2)
  • stock (19)
  • stocks (2)
  • strategic petroleum reserve (1)
  • Street (1)
  • stress (1)
  • Student (1)
  • sugar (1)
  • supply (5)
  • Supramax (1)
  • surplus (1)
  • surprise (1)
  • Swaps (1)
  • Swiss (2)
  • Switzerland (4)
  • takeover (1)
  • target (1)
  • tax (8)
  • taxation (1)
  • taxes (1)
  • Tekoa (1)
  • test (1)
  • testify (1)
  • The Real Crash (1)
  • Theory (2)
  • TLT (1)
  • total (4)
  • trade (1)
  • trade deficit (1)
  • transport (1)
  • treasuries (18)
  • treasury (10)
  • treasury holdings (2)
  • trust (3)
  • turbo (1)
  • Turk (5)
  • U.S. (21)
  • U.S. debt (1)
  • U.S. dollar (1)
  • U.S. Mint (2)
  • U.S. treasuries (1)
  • U.S. treasury holdings (1)
  • U3 (1)
  • U6 (1)
  • unemployment (17)
  • Unemployment rate (1)
  • united states (1)
  • up (1)
  • US (7)
  • USA (1)
  • USD (8)
  • Utilization (8)
  • Valcambi (1)
  • valuation (1)
  • Vegas (1)
  • velocity (5)
  • Visa (1)
  • volatility (1)
  • wage (3)
  • wages (1)
  • Wall (1)
  • Wall Street Journal (1)
  • War (3)
  • warehouse (1)
  • Warren (2)
  • wedge (1)
  • Western Potash (1)
  • wheat (2)
  • worker (1)
  • world (1)
  • World Market Window (1)
  • wrap (1)
  • WTI (1)
  • Yahoo (1)
  • year (2)
  • yen (2)
  • Yeul (1)
  • yield (11)
  • yields (2)
  • yuan (1)
  • zero (6)
  • Zero Hour (2)
  • Zero Hour Debt (1)
  • zerohedge (2)
  • zinc (1)

Blog Archive

  • ►  2013 (243)
    • ►  August (7)
    • ►  July (14)
    • ►  June (34)
    • ►  May (23)
    • ►  April (53)
    • ►  March (36)
    • ►  February (33)
    • ►  January (43)
  • ▼  2012 (257)
    • ►  December (42)
    • ►  November (26)
    • ►  October (30)
    • ►  September (20)
    • ▼  August (25)
      • The Effect of War on Silver
      • Another Correlation: What is China's Real Growth R...
      • Got Gold Report August 26: Gold/Silver moving upwards
      • Correlation: Australian Dollar Vs. Iron Ore
      • Gold: Supply and Demand
      • Keith Fitz-Gerald and Chris Martenson on Japan
      • Euro Vs. USD: Take Two
      • Summary of All Discovered Correlations
      • Belgium: Real Estate Starts Falling
      • Scott Minerd: The Faustian Bargain
      • Non-Farm Payrolls and Unemployment: Another Correl...
      • Analyzing Federal Debt held by Foreigners
      • Marc Faber: Middle East Conference 2012
      • A Detailed Federal Reserve Balance Sheet
      • The Simplified Bank Stress Test
      • Silver Inventories at CME and Lease Rates
      • China U.S. Treasury Holdings Steady in June 2012
      • Capacity Utilization highest since April 2008
      • Amber Gold, another MF Global
      • Comparing the Dow Jones and Shanghai Composite aga...
      • China Gold Imports drop another 10% in June 2012
      • Update on Silver Net Short Positions: LCNS
      • China Outperforms Anyone
      • Biggest drop in U.S. bonds in 2 months
      • Merger and Acquisition (M&A) activity is growing i...
    • ►  July (32)
    • ►  June (30)
    • ►  May (29)
    • ►  April (23)
Powered by Blogger.

About Me

Unknown
View my complete profile