Thanks to Dieuwer from Seekingalpha, who pointed out I make a lot of mistakes, I now have a very interesting site to share. Namely: http://www.cotpricecharts.com/commitmentscurrent/
On that site, the two most important ones for me are the one for silver/gold and the other for 10 year bonds.
Gold: http://snalaska.com/cot/current/charts/GC.png
Silver: http://snalaska.com/cot/current/charts/SI.png
10 year bonds: http://snalaska.com/cot/current/charts/TY.png
Let's talk about the silver one first. Chart 1 gives us immediately the commercial interest. And we see that today the commercials are pretty short silver. That means that silver will be weak at this time.
Once the commercials start to become long again (purple chart goes up), like in July of 2012, then you need to start buying silver. And indeed, when you look at the silver price in July 2012, it bottomed out. So this COT site, is a must, to monitor each week.
 |
| Chart 1: Silver Open Interest |
 |
| Chart 2: Silver price |
And it works like candy...
 |
| Chart 3: 10 Year Treasuries Open Interest |
 |
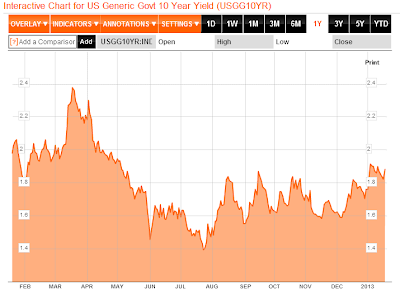
| Chart 4: 10 Year Treasury Yields |


0 comments:
Post a Comment