Looks like the media is telling us that the GLD trust physical gold holdings are rising and giving a boost to the precious metals prices.I don't believe it until I see it.When I make the chart, I see that we are bottoming out (red chart), but by no means we are really seeing a pick up in GLD trust physical gold holdings yet. We will have to wait for a longer time frame to confirm this uptrend.I need to admit that the red chart is bottoming out though....
Monday, 12 August 2013
Thursday, 8 August 2013
Peter Schiff: Stand-Up Comedian
Posted on 14:19 by Unknown
As I always said, Peter would be a perfect Stand-Up Comedian. And here we have it...
Wednesday, 7 August 2013
Gold Lease Rate Higher, Registered COMEX Gold Lower
Posted on 13:45 by Unknown
Just another update.Gold Lease Rates are at an all time high again:Chart 1: Gold Lease RateCOMEX registered gold has once declined to even lower levels. J.P. Morgan unloaded its registered gold. Total registered gold at COMEX now stands at: 875713 troy ounces. We are nearing the bottom.Chart 2: COMEX g...
The Declining Trade Deficit: Not As Rosy As You Would Think
Posted on 12:47 by Unknown
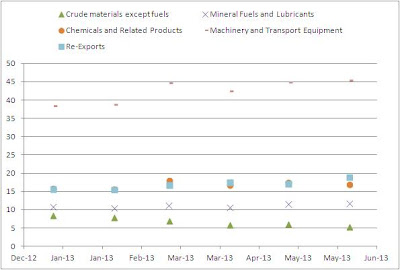
The trade deficit numbers are out for June 2013 and have been very positive. Due to an oil boom, the trade deficit shrank 22% from around $44 billion in January 2013 to $34 billion in June 2013.As you can see on Chart 1, the decrease in deficit was due to an increase in exports (red chart) and a decrease in imports (blue chart). This looks very promising, but I want to show that not all is well if you look into the details.Chart 1: Import Vs. ExportLet's...
Tuesday, 6 August 2013
China Gold Imports from Hong Kong: Steady in June 2013
Posted on 08:44 by Unknown
In June 2013, the gold imports from Hong Kong to China were essentially flat.The summer isn't a good period for gold either, so this is pretty normal. But anyway, gross and net imports are still at an all time high, compared to history (see chart 2).And what's also interesting is that the ratio between net imports and gross imports are at an all time high too: 89%. China wants to keep all its go...
Friday, 2 August 2013
Tax Receipts Vs. Savings Rate
Posted on 23:55 by Unknown

Whenever the government raises taxes or when corporate profits rise, tax revenue will rise with it (blue chart).But this has implications, if tax revenues rise, this will deplete the personal savings of the people. The red chart shows the personal savings rate (%). There is a negative correlation to be found here.It shows us that higher tax revenues always lead to lower personal savings rates and vice versa. From this correlation we can deduct one...
Gold Backwardation Explained By James Turk
Posted on 10:15 by Unknown
If you want to know what gold backwardation means, read this article of James Turk. Very interesting.Let's say we have two currencies A (euro) and B (USD). Then the following is true:- A's interest rate < B's interest rate- A is in contango against B- A's value rises going into the future- Higher interest rates means a higher risk of debasement of the currency.Now let's look at two other currencies A (USD) and B (gold):- USD's interest rate < gold's interest rate (lease rate)- USD is in contango against gold (or gold is in backwardation)-...
Wednesday, 31 July 2013
New GDP Calculation taking effect
Posted on 13:32 by Unknown
If you recall my article on the newly invented way of calculating GDP, well we are at that point now.Today, the new GDP numbers (including legal bills, art, music, theatre and imaginary pension funds) were in effect. Real GDP grew 1.7% on an annualized basis in the second quarter of 2013.As you can see, the old nominal GDP numbers (red chart) and the new nominal GDP numbers (green chart) are about 3% different from each other. Nominal GDPWith...
Friday, 19 July 2013
COMEX stock touches new lows
Posted on 14:05 by Unknown
And we have new lows this week. Total gold stock goes to 6989165 troy ounc...
Tuesday, 16 July 2013
Single Family Housing Starts Vs. Unemployment Rate
Posted on 09:15 by Unknown
One of the key metrics for the health in the housing market are the "privately owned housing starts". "Housing starts" are an economic indicator that reflect the number of privately owned new houses (technically housing units) on which construction has been started in a given period. Usually, a decline in the "housing starts" leads to the start of a recession. The "housing starts" are a leading indicator for the unemployment rate. Both...
Monday, 15 July 2013
Correlation: Employment-Population Ratio Vs. Real GDP per Capita
Posted on 10:02 by Unknown
I like statistics that can't be fudged by the government and this is one of them: The Civilian Employment-Population Ratio. This measure is one of the best to evaluate the labor market. Each time when this ratio declines, we enter a recession. So this is a very good gauge in predicting bad periods in the overall economy.A high ratio (above 70%) means that a lot of people are employed and this will result in a high GDP per capita. A low ratio (under...
Posted in capita, correlation, Denninger, Employment, gdp, Greg, Hunter, Karl, population, real
|
No comments
Sunday, 14 July 2013
Copper goes into backwardation
Posted on 15:09 by Unknown
As gold went into backwardation, now also copper starts going into backwardation.We should see some upside in copper following this move into backwardation. But as opposed to gold, backwardation in copper isn't a good sign for the copper price. Meaning, if we see too much backwardation in copper (red curve making a bottom), you should expect a top in the copper pri...
Wednesday, 10 July 2013
COMEX less than 1 million ounces physical gold left
Posted on 12:49 by Unknown
We're getting closer to the zero line...At this pace we will have the unthinkable "event" at the end of this mon...
Consumer Price Index: The effect of a rise in oil prices
Posted on 08:50 by Unknown
With crude oil going back over $106/barrel (which is a 20% increase from $90/barrel), let's see how the CPI would do.As you know, the consumer price index consists mostly of housing (42%), then second comes transportation (17%) and last comes food (15%).The crude oil is part of the transportation segment. One third of the transportation segment is motor fuel or 5% of the CPI.So if oil prices go up 20%, the CPI will only go up 20% x 5% = 1%. More...
Monday, 8 July 2013
Red Alert: Gold Forward Rates Turn Negative
Posted on 10:35 by Unknown
As I told before, the only parameter that is going to dictate gold lease rates, is the GOFO rate, because the Federal Reserve will always keep the fed funds rate at zero, which means the LIBOR rate will stay at zero. The GOFO rate though, is dependant on the demand and supply mechanics of gold. And today we have the first time that the GOFO rate actually turned negative, which is officially a backwardation in gold. Since the 2008 crisis hit...
Sunday, 7 July 2013
The True Jobs Numbers
Posted on 01:30 by Unknown
Just a reminder to those who thought the jobs numbers on Friday were positive.See the blue line (and just recently also the grey lin...
Friday, 5 July 2013
Federal Reserve: To Taper or not to Taper
Posted on 16:41 by Unknown
There is all this talk about "tapering". Will the Federal Reserve taper or not taper, that's the question. To find the answer, we need to take a look at the U.S. national debt.This is really a weird sight, do we really have an actual debt ceiling? Aren't we going to raise the debt ceiling? U.S. public debt has been growing at almost $200 billion a month and has been staying flat just recently.Chart 1: U.S. Public DebtSince May 19, 2013, the debt...
Registered gold at COMEX at all time lows
Posted on 12:41 by Unknown
A 30% drop in registered gold at the Brink's vault and a 15% drop in registered gold at Scotia Mocatta marks a huge total drop of more than 200000 ounces of gold at the COMEX.We are on course for a total sell out in physical gold at the COMEX at the end of the summer. We also see this in the spiking gold lease rates and lower gold forward rates.It is going to be interesting. What happens when the blue line intersects with zero? Any predictio...
China Gold Imports Edging Upwards in May 2013
Posted on 09:36 by Unknown
The gold imports in May 2013 were a bit disappointing again, gross imports didn't budge much.But the net imports surged to 106 tonnes in May 2013, meaning that China kept all the imports from Hong Kong. The ratio of net imports to gross imports is 83%.But it's still a positive development for the gold market, net imports continue to trend high...
Wednesday, 3 July 2013
Correlation: Mortgage Rates Vs. Mortgage Applications Vs. Pending Home Sales
Posted on 13:47 by Unknown
Just discovered another correlation on Zero Hedge. If mortgage rates go up, lending becomes more difficult, so people stop applying for new mortgages. This means there is a negative correlation between mortgage rates and mortgage applications.When mortgage applications go down, not a lot of homes will be sold. This means that home sales will go down. As suggested by the following chart, there is a correlation here between mortgage applications and...
Posted in applications, correlation, correlations, Hedge, home, mortgage, pending, rate, sales, zero
|
No comments
Shanghai Gold Premium Hit Another Record High
Posted on 13:24 by Unknown
Almost each day marks another record high in Shanghai gold premiums to London spot price. We have hit 3% premiums.They are really gobbling up the gold, that I can say.Chart 1: Shanghai Gold Prem...
Sunday, 30 June 2013
Croatia To Join European Union
Posted on 11:00 by Unknown
Today, Croatia joined the European Union, time to celebrate! But should we really celebrate?What we took in the European Union is a bunch of problems.First off, the unemployment rate of Croatia is a staggering 20%, rivalling with Spain and Greece.Second, its balance of trade is negative and has always posted a trade deficit.To make matters worse, since 2008, the country was in recession and is still in a recession. Added to this, there is an almost...
Unemployment Vs. Real GDP
Posted on 04:55 by Unknown

The inverted Unemployment Rate is correlated to Real GDP and is also known as Okun's Law named after Arthur Melvin Okun. Zero Hedge featured Okun's Law in this article.Red curve: inverted yoy% change in unemployment rateBlue curve: yoy% change in real GDPNever in history has the unemployment rate been so artificially low (red graph artificially high) as today. The red curve has never been higher than the blue curve, which implies that the unemployment...
About Delivery Ratio and Cover Ratio at the COMEX
Posted on 00:04 by Unknown
Interesting article by Jan Skoyles.http://therealasset.co.uk/comex-2-paper-gold/The summary says to us that the amount of gold bullion backing COMEX obligations is at an all time low (Cover Ratio). Meaning, there is very little gold backing at the COMEX.If the delivery ratio (amount of delivered gold against contracts) ever spikes upwards, the COMEX could get under stress. Today, we are still fine, because people aren't really taking delivery as much as they should be.Also notable is that registered stock is declining at a much faster pace than...
Thursday, 27 June 2013
PIIGS Bank Deposits Outflow Accelerating
Posted on 12:51 by Unknown
As I noted a month earlier, Spain's bank deposits posted an outflow and this outflow is accelerating for the month of May 2013. This time, Italy is posting outflows too.Greece, Cyprus are of course still in a decline. I expect bail-ins to come if this trend continues. Europeans should be worried about their deposi...
Case Study on the Housing Market of Belgium and The Netherlands
Posted on 12:09 by Unknown
With the newly discovered correlation between building permits and housing prices, I wanted to put this correlation into practice more at home. Let's see how The Netherlands is doing. On Chart 1 we see that since 2006, the amount of building permits has dropped and is continuing to drop.Chart 1: Building Permits in The NetherlandsA similar case is found in Belgium, where we see that the amount of building permits dropped since the top of 2006 (Chart...
Building Permits Vs. Housing Market
Posted on 10:35 by Unknown
The authorization of building permits is a leading indicator for the housing market. As you can see on this chart, the new private housing units authorized by building permits move first, while the house price index moves several months later. This way, you can predict the direction of the real estate market. On June 2013, the direction of the housing market is clearly upwar...
Correlation: Lumber Vs. Housing
Posted on 10:15 by Unknown
Apparently the lumber price is a leading indicator and a proxy for the housing market. (Zero Hedge)If the lumber price goes up, 2 months later, the housing market goes up. The same happens the other way round.So it's very important to watch the lumber price, which can be found here.http://www.nasdaq.com/markets/lumber.aspx?timeframe=10yAnd even more important, if this correlation is real, then you can just predict the market and earn money by betting...
Wednesday, 26 June 2013
The Housing Bubble is Deflating
Posted on 09:41 by Unknown
With the recent surge in the mortgage yields, let's see how the housing market is doing. The two key metrics to look at are mortgage rates and household income. Let's analyze the mortgage rates first.Historically, there is a high correlation between 30 year U.S. treasuries and 30 year mortgage rates (Chart 1). The chart shows that the 30 year treasury yield has spiked upwards starting in 2013, so I expect that the 30 year mortgage rates will spike...
Subscribe to:
Posts (Atom)